When trying to understand a user’s journey through your product, you’ll likely turn to your company’s events data, which records users’ actions like clicks, form fills, purchases, and other product behavior. But without the context of when these events occurred, it's hard to translate individual actions into a complete picture of the user journey 🤔.
That’s where sessionization comes in.
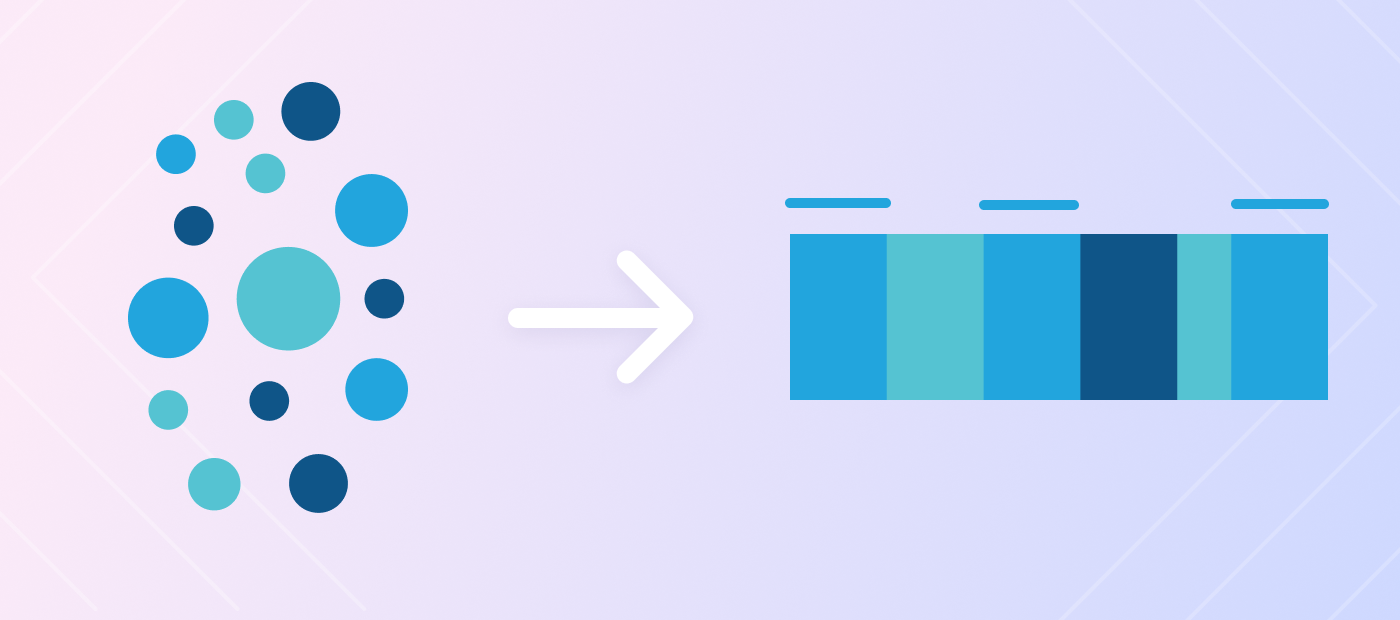
When you “sessionize” your event data, you group events into sessions that capture some time-bound record of product usage (for example, a “cart abandonment” session in which a user added a few things to their cart but left without purchasing). This gives you a chance to put your product hat on by analyzing events as part of a journey a user took through your product, rather than a collection of random actions. With your sessionized data, you can do lots of interesting analyses, like a funnel analysis, to help you understand where folks are getting stuck and what actions your Marketing, Sales, or Product team can take to improve conversion 💪.
Here’s a quick demo to show you how sessionization works.
While you can definitely do this in other tools, I enjoy being able to mix custom SQL and a reusable data model in Omni for this. As an analyst, I can define sessions using custom code, then make the results accessible to our entire organization via the data model so they can interact with these insights via familiar Excel-style formulas, SQL, or our easy point-and-click UI — depending on their preference. You can also combine your event data with other data (such as sales, marketing, and customer support) to get an even more complete view of the activities that may impact the user experience.
Keep reading for an overview of the key steps for sessionization. It’s not too bad, I promise!
Decide on the definition of a
sessionFor each event, calculate the time since the previous event (partitioned by user)
Define sessions based on the time since the previous event
Join each event to its corresponding session and aggregate to get session-level metrics
Below, we’ll walk through how these steps build toward this SQL code that sessionizes your event data…
...which results in a table with key session metrics like this 👇
session_id | user_id | session_start | user_session_sequence_no | last_event_at | session_duration_seconds | events_in_session |
1 | 4 | 2024-01-01 10:59:00 | 1 | 2024-01-01 11:24:00 | 1500 | 2 |
3 | 4 | 2024-01-01 11:59:00 | 2 | 2024-01-01 11:59:00 | 1700 | 1 |
📔 Note: This example SQL code is written for Snowflake SQL, but the logic can be easily adjusted to work for your SQL dialect.
Step 1: Decide on a definition of a session #
There are multiple ways you can define a session. One option is to use a time-based definition – for example, you can decide that a session will expire at midnight every day. Another option that’s helpful when looking at web traffic sessions is a campaign-based definition – for example, a new session would begin any time a user arrives at your site via a different campaign (Facebook, Google, etc.).
For the sake of this analysis, we’ll use a popular variation of a time-based definition: a “session timeout” length, or a maximum length of time between events that still qualifies a user as “active.” This is useful because it lets you analyze user behavior contained to a period of active usage, but it can also be difficult to nail down since users often multi-task among many apps. For example, with Omni, developers may be toggling between Omni and dbt as they update the model, and analysts may be switching between Omni and Google Slides while they're building a metrics slide deck. In either case, we'd want to define some period where they're 'active' in Omni.
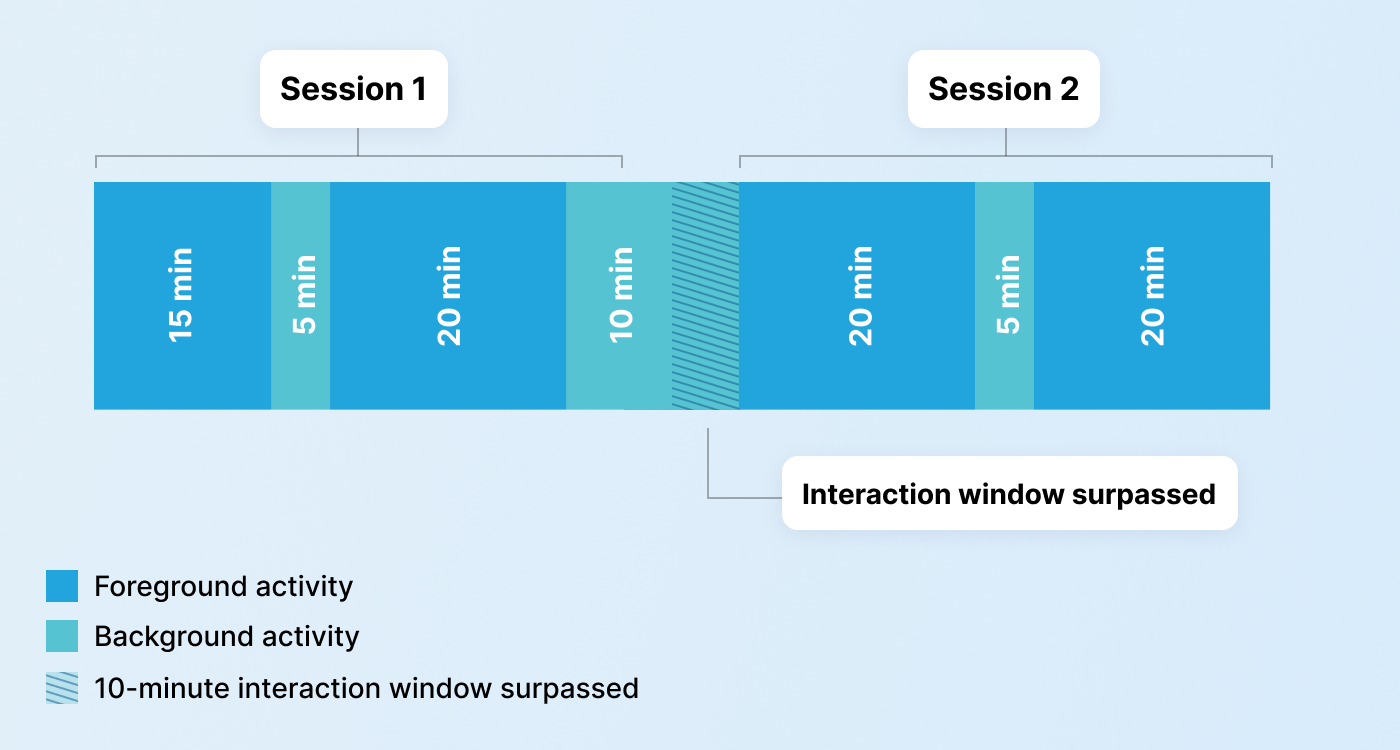
💡 Tip: A 30-minute session timeout is standard, but you may want to check with your Engineering team to see if they already have a session timeout value. *Engineers may have a session timeout value defined to log users out after the session timeout period for security reasons, or to prompt users with a notification to re-engage them.
Step 2: For each event, calculate the time elapsed since the previous event (partitioned by user) #
To see how long has elapsed between each user’s events, run some SQL using window functions. This lets you better understand the timing of user actions in your product to help inform when nudges might be relevant (for example, pop-up notifications when someone has been idle for some time).
Let’s assume your events data looks like this:
id | user_id | event_type | created_at |
1 | 4 | clicked_signup_form | 2024-01-01 10:59:00 |
2 | 4 | input_email | 2024-01-01 11:24:00 |
3 | 4 | opened_app | 2024-01-01 11:55:00 |
Then the first CTE of your SQL query can look like this:
To result in this table:
id | user_id | created_at | minutes_since_prior_event |
1 | 4 | 2024-01-01 10:59:00 | null |
2 | 4 | 2024-01-01 11:24:00 | 25 |
3 | 4 | 2024-01-01 11:59:00 | 35 |
Step 3: Define sessions based on the time since the previous event #
Now, we can start identifying unique sessions. This lets you zoom in from a bird’s eye view of many user’s actions in your product to a specific user’s experience with your product. This part is a bit complicated; we’ll walk through it step-by-step, but here’s the second CTE we’re building toward:
With our
first_passtable, we can easily identify which events denote the “start” of a session: it’s the events that are either (a) the user’s first event ever or (b) more than 30 minutes since the previous event. So we start by filtering for only these events:WHERE minutes_since_prior_event > 30 OR minutes_since_prior_event IS NULLBy filtering in #1, we now have a table where each row represents a unique session. Since each event ID is unique, we can repurpose the event ID to become the session ID:
id AS session_idNext, we can add the start time of each user’s next session to demarcate the time boundaries for events that fall into each session:
LEAD(created_at) OVER (PARTITION BY user_id ORDER BY created_at) AS next_session_startWe can also add a user_sesssion_sequence_no so we can easily filter for a user’s 1st, 2nd… Nth session:
ROW_NUMBER() OVER (PARTITION BY user_id ORDER BY created_at) AS user_sesssion_sequence_noFinally, we can add the user_id and session_start times:
user_id, created_at AS session_start
→ Altogether, this turns our first_pass table of events into a sessions table that looks like this:
session_id | user_id | session_start | next_session_start | user_session_sequence_no |
1 | 4 | 2024-01-01 10:59:00 | 2024-01-01 11:59:00 | 1 |
3 | 4 | 2024-01-01 11:59:00 | null | 2 |
Step 4: Join each event to its corresponding session #
We now have a list of sessions with a start and end time, as well as a list of events with timestamps. Next, we want to identify some more details about each session, including:
The timestamp of the last event in the session (i.e. when the session “ended”)
How long the session was
How many events occurred in the session
To do that, we can use a SQL join to identify which session each event belongs to and aggregate per session:
In the join above, we’re checking to ensure:
The
user_idof the event matches the user_id of the sessions (events.user_id = sessions.user_id)The event happened at the exact same time or after the session started (
events.created_at >= sessions.session_start)The event happened before the next session started, or the event is part of the current session (
events.created_at < sessions.next_session_start OR sessions.next_session_start IS NULL)
Once we complete the join, each event will be attached to a session 🎉
From here, all we need to do is aggregate on a per-session level, then calculate our final metrics:
The timestamp of the last event in the session:
MAX(events.created_at) AS last_event_at💡Note: This is different from `sessions.next_session_start`, which is the beginning of the next session, not the last event in the current session.- The session duration (between first and last event):
We use a CASE WHEN statement here to check whether or not a given session length returns 0. If so, this means that a given session is either (1) the current session (still in progress), or (2) it was a session with only 1 event. In the first case, we return the difference between the session start and the current time. In the second case, we return the maximum session length.
The number of events in the session:
COUNT(*) AS events_in_session
All these SQL blocks come together to produce this query:
Ultimately, running this SQL block results in a session-level table like this:
session_id | user_id | session_start | user_session_sequence_no | last_event_at | session_duration_seconds | events_in_session |
1 | 4 | 2024-01-01 10:59:00 | 1 | 2024-01-01 11:24:00 | 1500 | 2 |
3 | 4 | 2024-01-01 11:59:00 | 2 | 2024-01-01 11:59:00 | 1700 | 1 |
Conclusion #
Sessionization helps you go from isolated data points to a more robust picture of your user journey. That way, you can learn from users’ experiences to make impactful decisions for marketing, sales, product, and more. Personally, this is what I love about analytics: bringing together the numbers and the user experience to surface insights that move the business forward.
Here at Omni, we believe in combining the structure of a data model with the freedom of SQL because of cases just like this. Sometimes you need a little SQL to get your analysis going, and then you can bring that transformation into the model to build reusable, governed metrics for your team. If you’re curious to learn more, we’d love to help you.