Self-service analytics that scales
Anyone can get the answers they need with Omni. AI, dashboards, workbooks, spreadsheets and more — all in one place.
Free Trial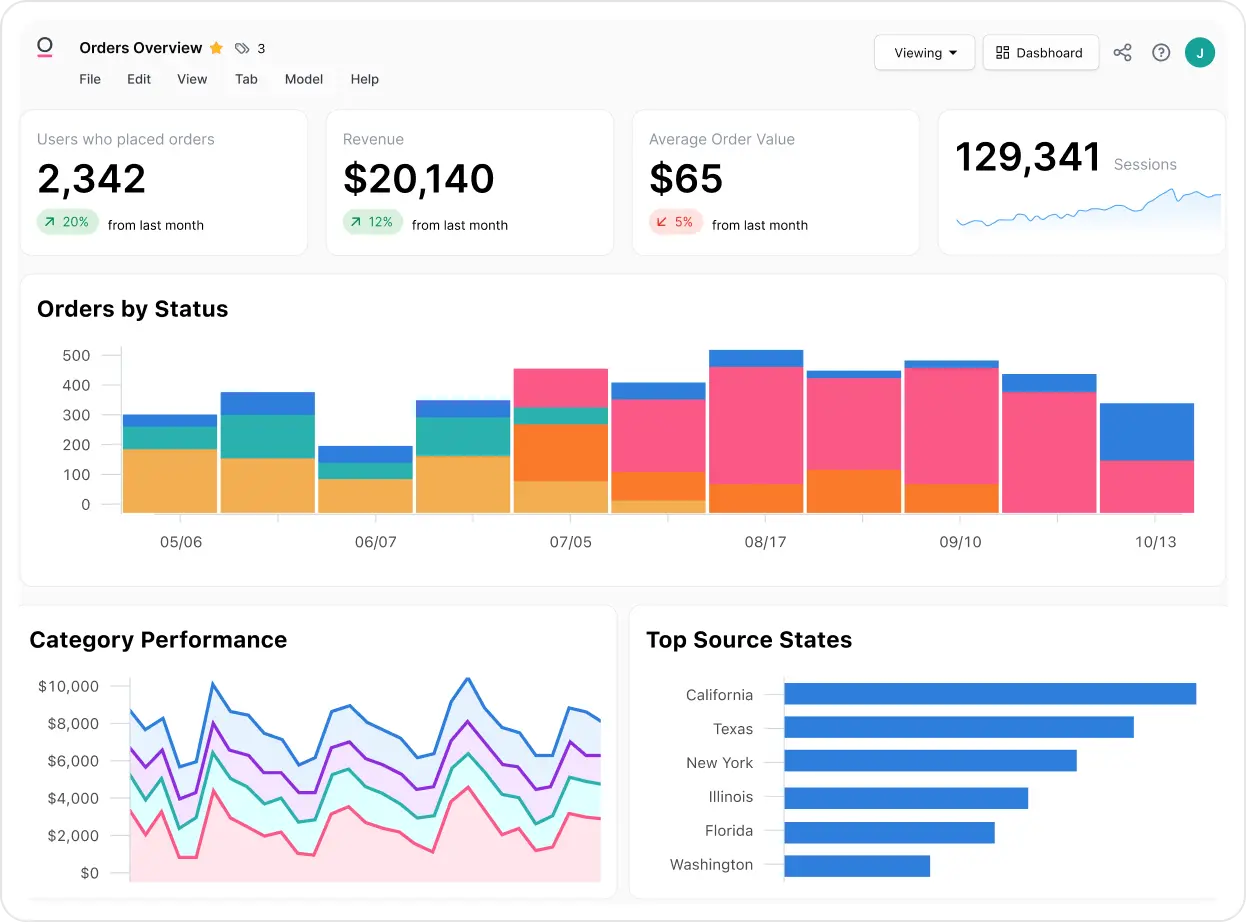


Make better, faster decisions with Omni
Give your entire team the ability to view, analyze, and securely share data in the way that works best for them.
Meet teams where they are
Ask a question in natural language, run Excel formulas on live data, or drop into SQL — whatever format fits the task, without switching tools.
Self-service without the sprawl
Omni's semantic layer gives the whole company room to explore while keeping metrics consistent. Enable everyone to query without losing control.
Bring data into every workflow
Deliver results to Slack and email, set up data alerts, or use Omni's MCP server and APIs to query governed data directly in other platforms.
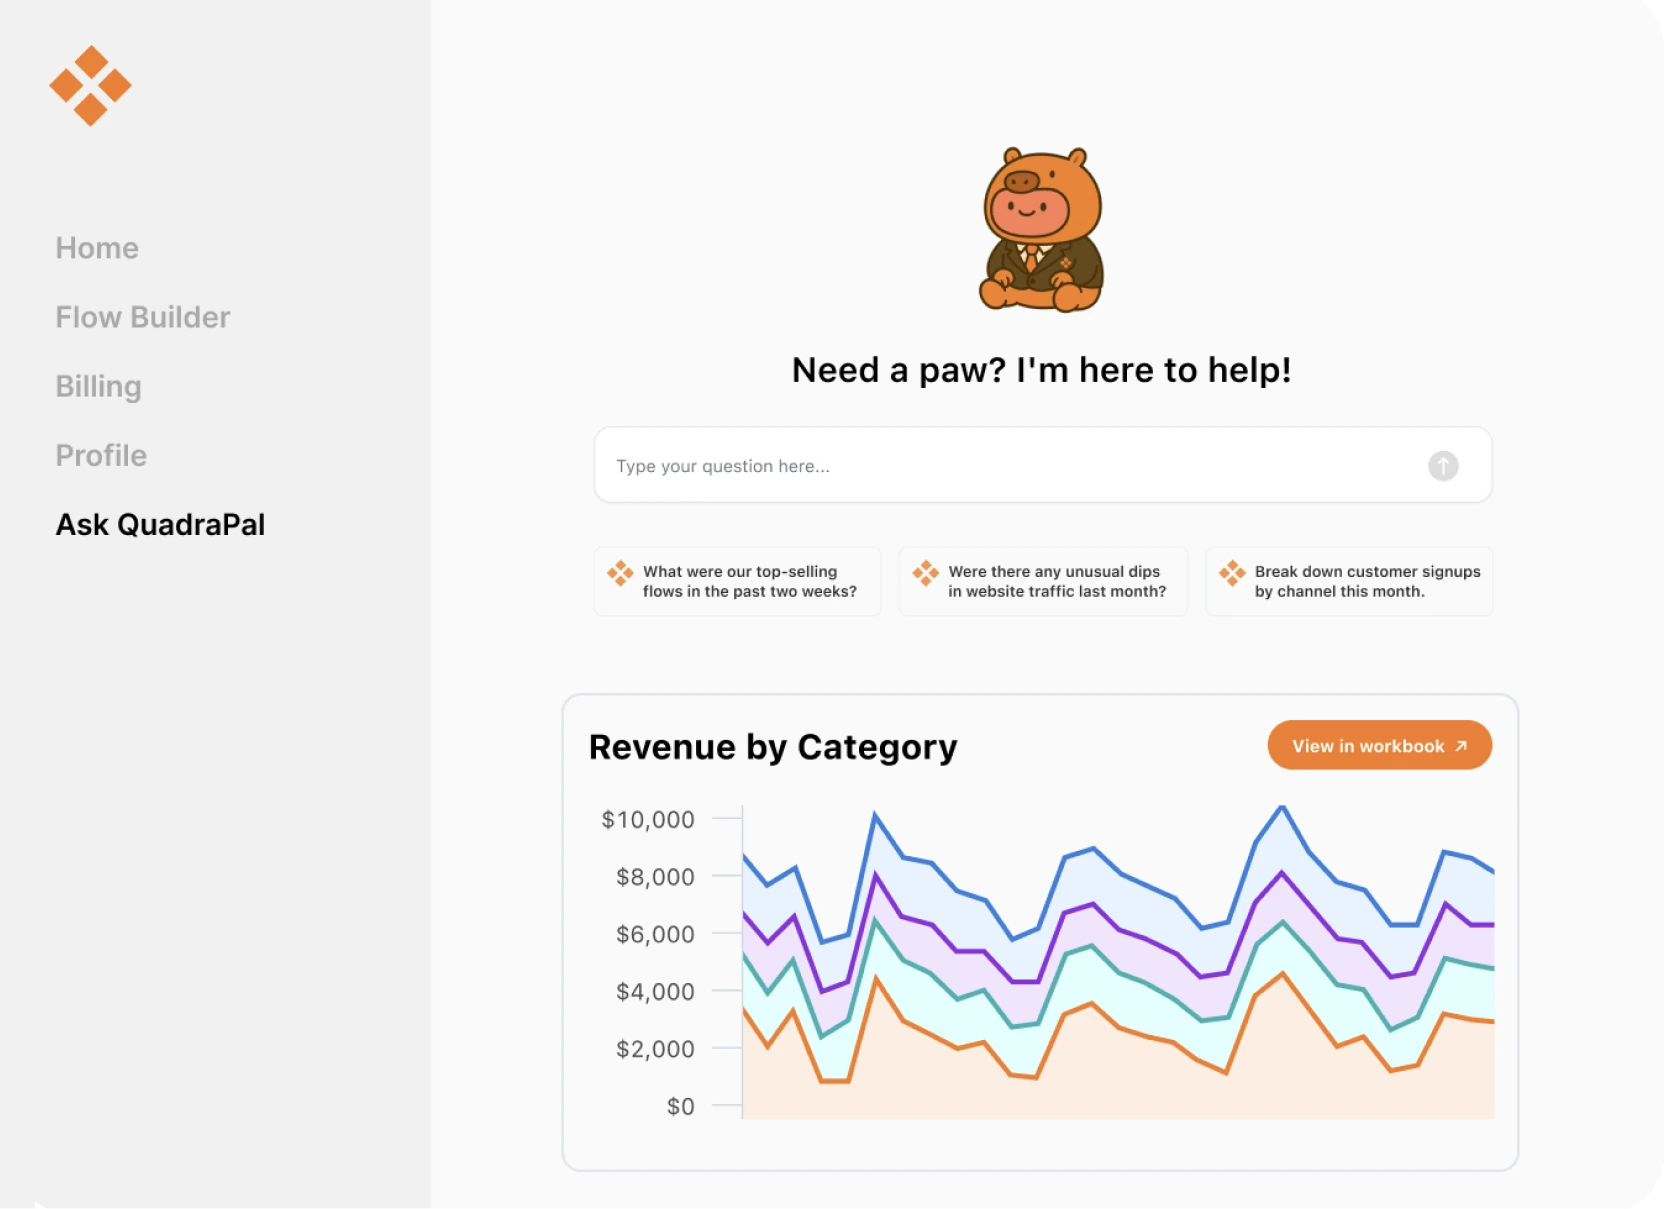
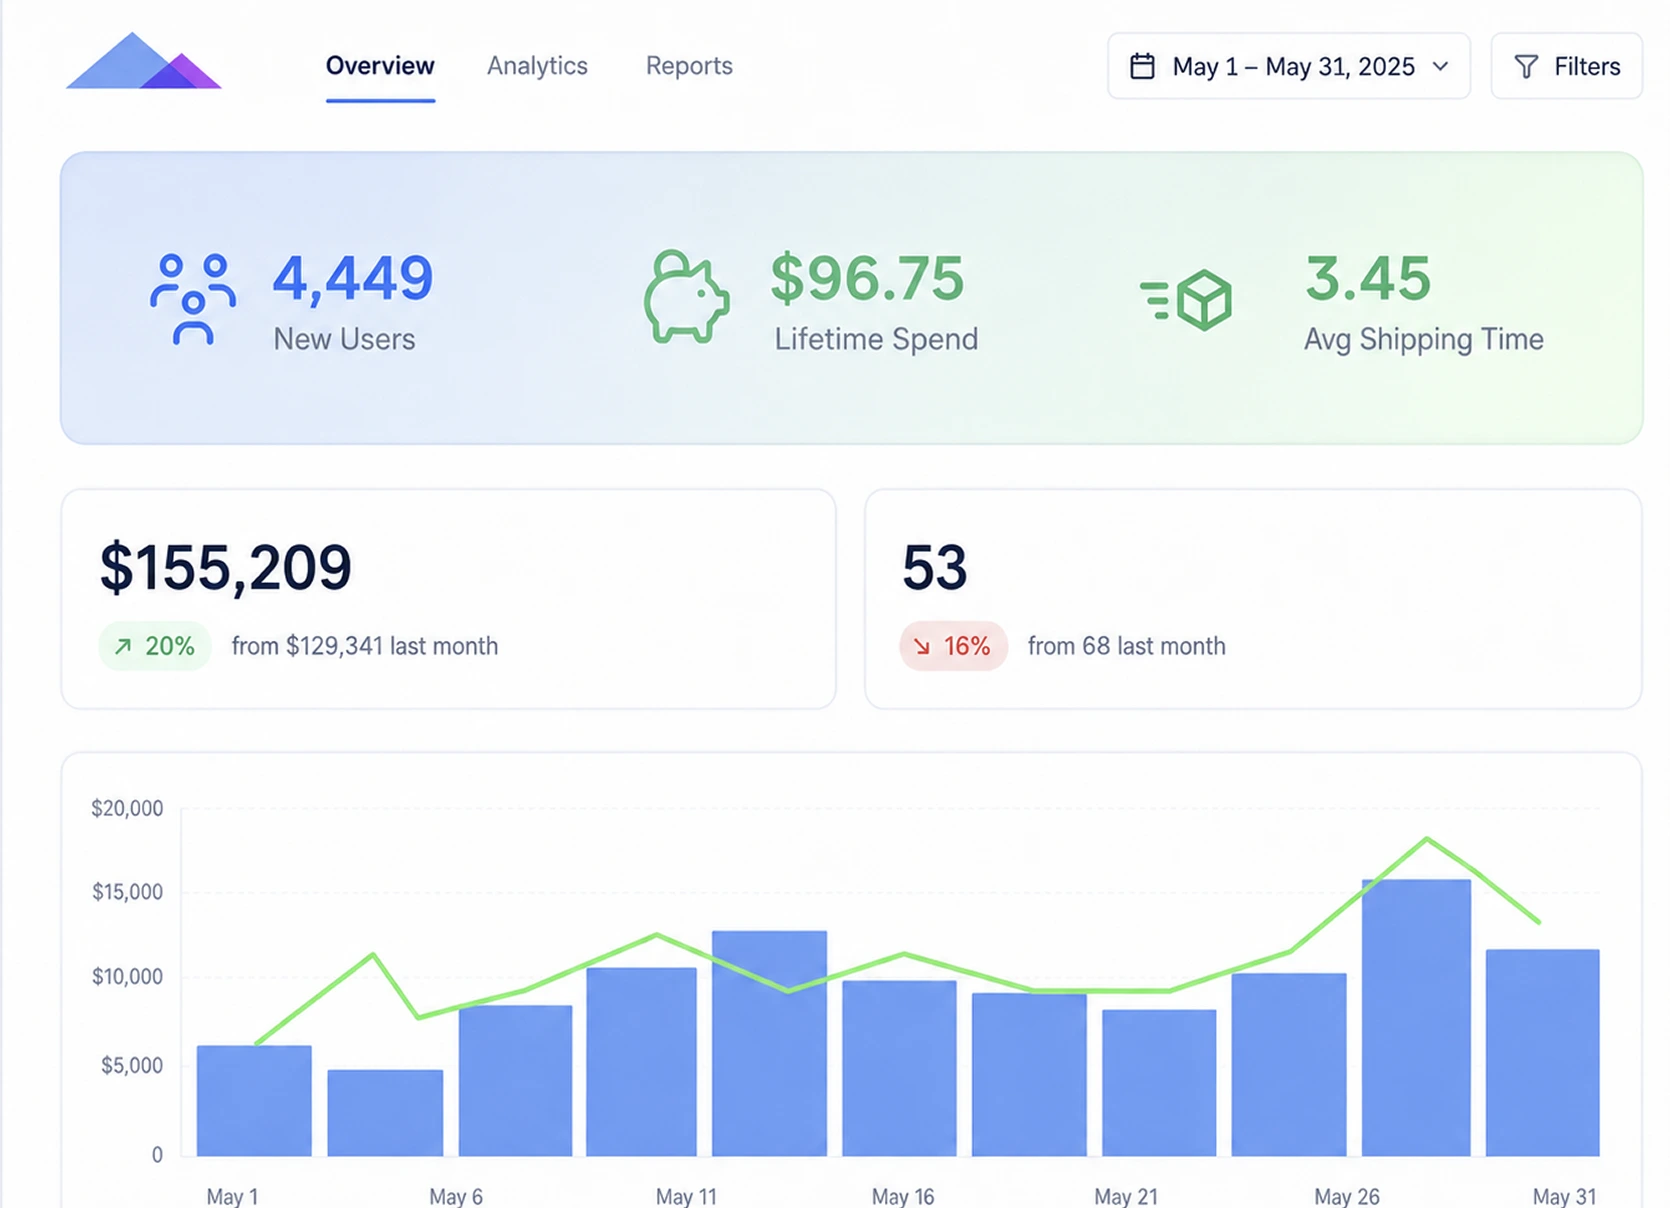
Dashboards that bring your data to life
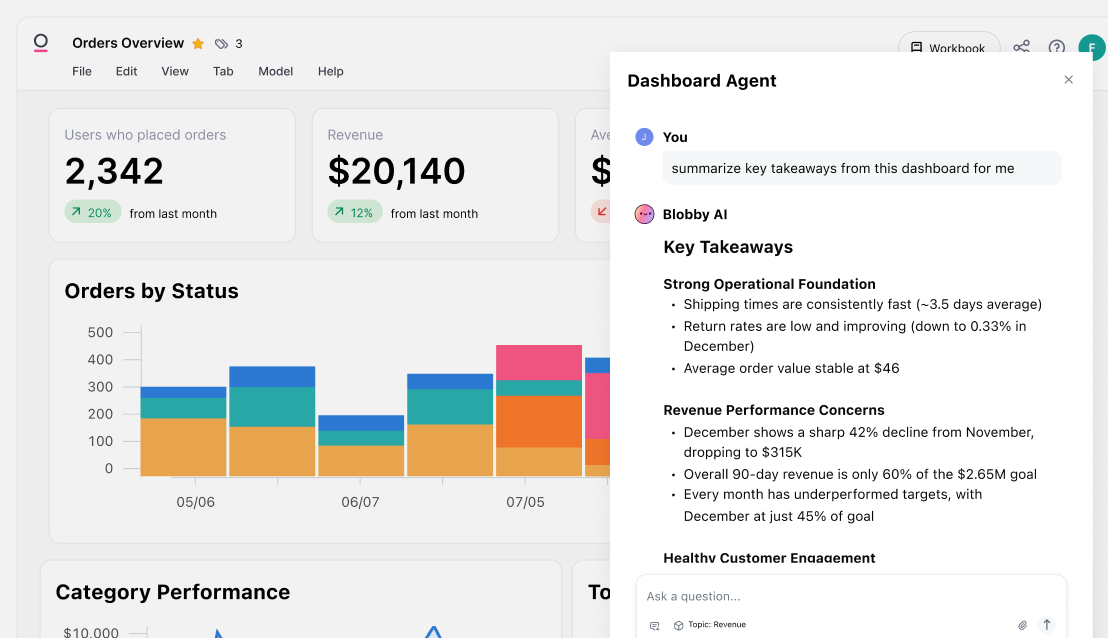
Dashboard Agent
Ask follow-up questions about anything you see. Or generate fully formatted dashboards with a prompt — so you can go from idea to shareable insights in seconds.
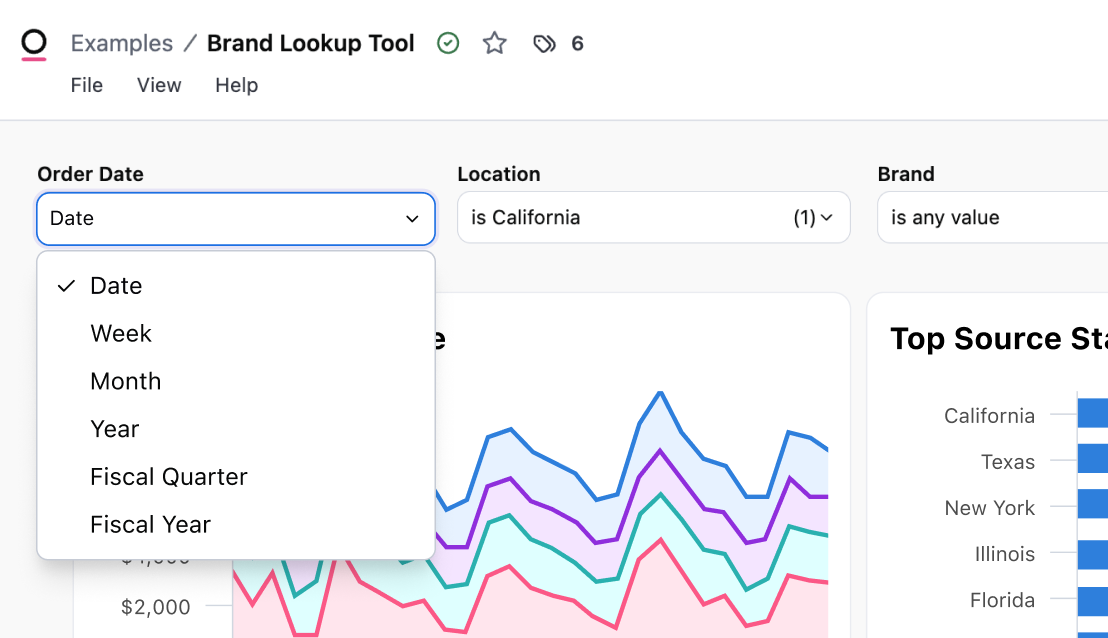
Field & time grain selectors
No need to build separate fields for every data cut. Set up dynamic field swappers, period-over-period controls, and time grain selectors to make it easy to get the data you want to see.
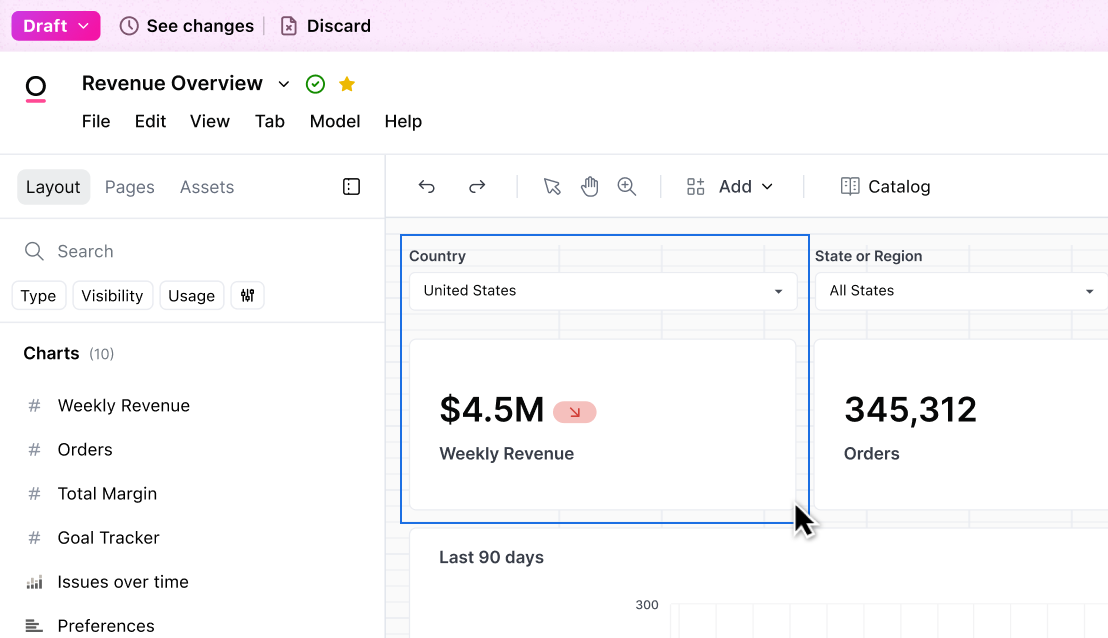
Dynamic layouts
Build dashboards that adapt to your content. Create tabbed layouts, resize and reorder tiles freely, and design views that look great on any screen — no code required.
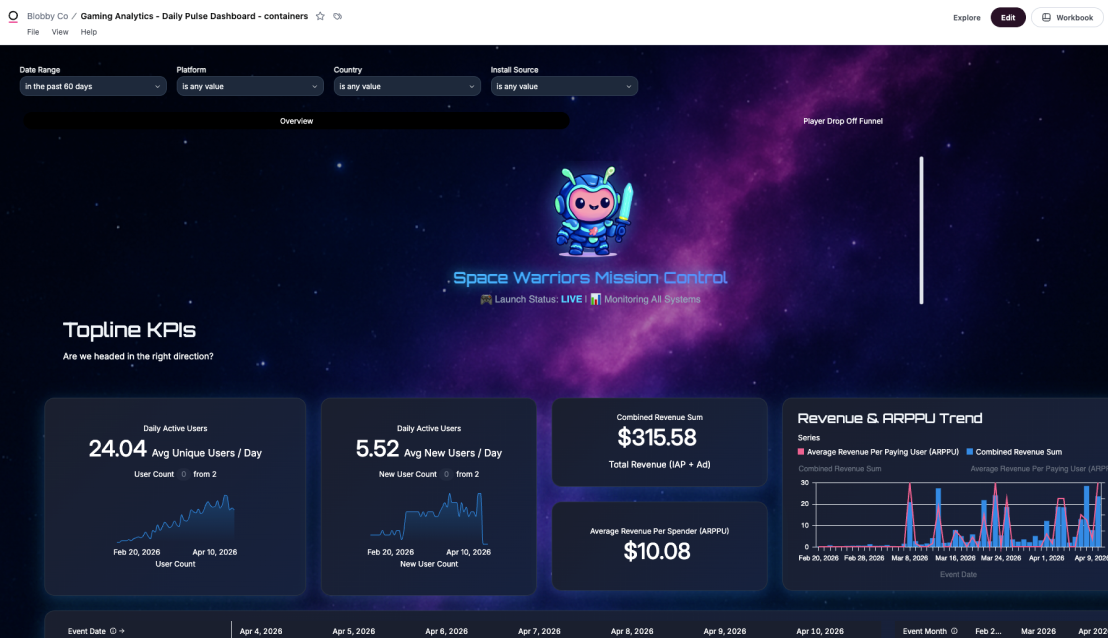
Custom themes
Match your brand exactly. Define custom color palettes, fonts, and chart styles so every dashboard looks like it was built in-house — whether it's for internal teams or embedded in your product.
Workbooks make it easy to dig deeper
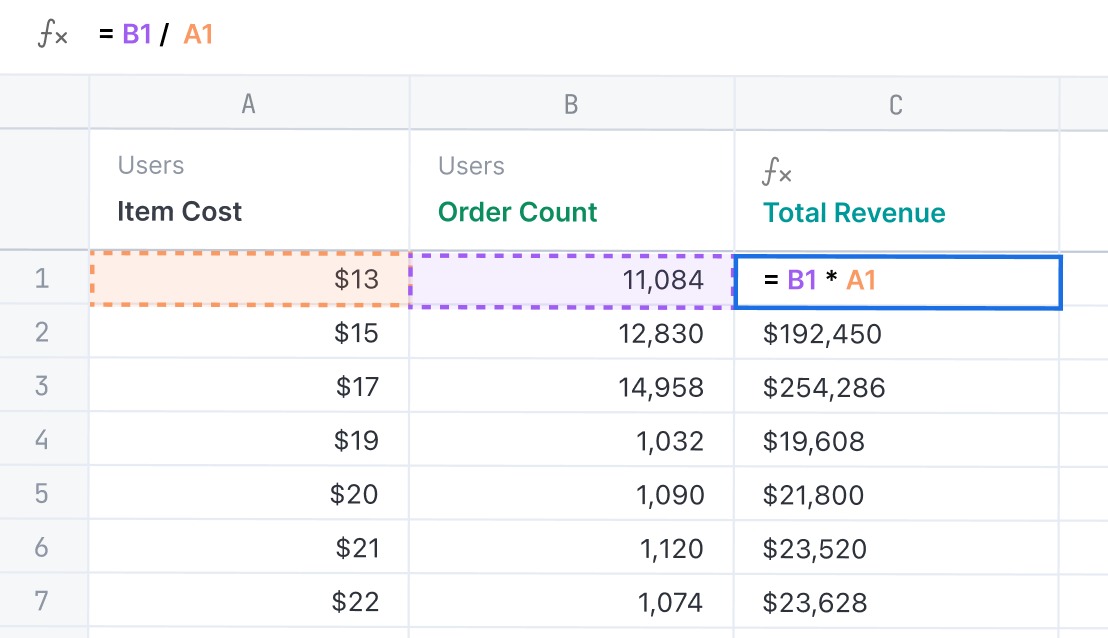
Excel formulas
Use the formulas you already know. Omni supports Excel-style functions — IF, VLOOKUP, SUMIF, and more — so your team can do ad hoc calculations directly in workbooks without learning a new tool.
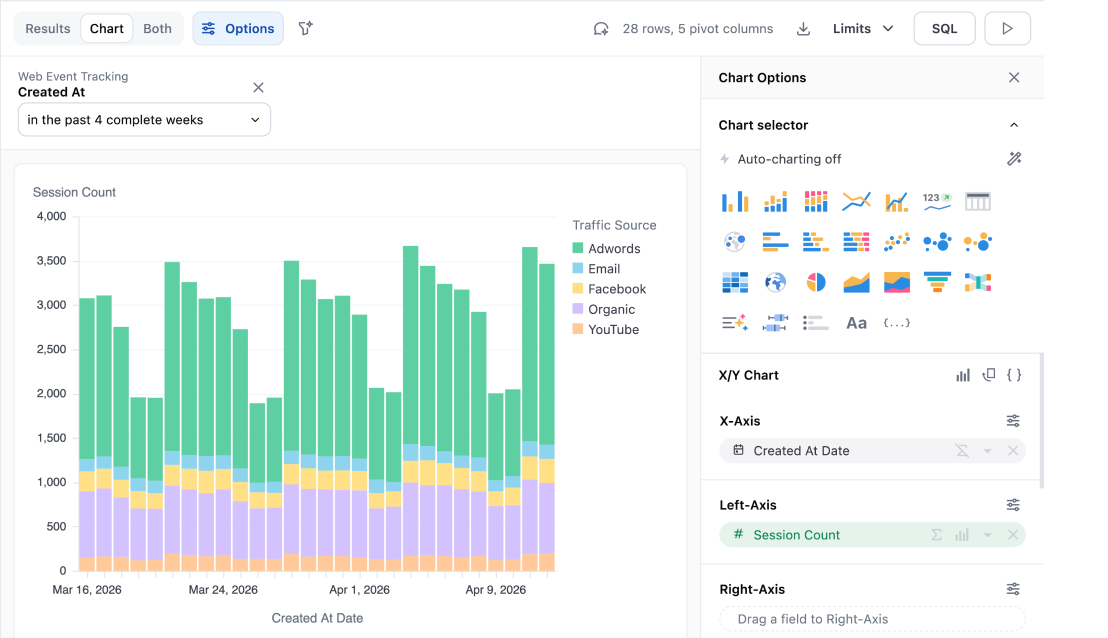
Visualization editor
Configure charts exactly how you want them. Swap chart types, adjust axes, control colors, and fine-tune every detail with a point-and-click editor — no code needed to get the perfect visual.
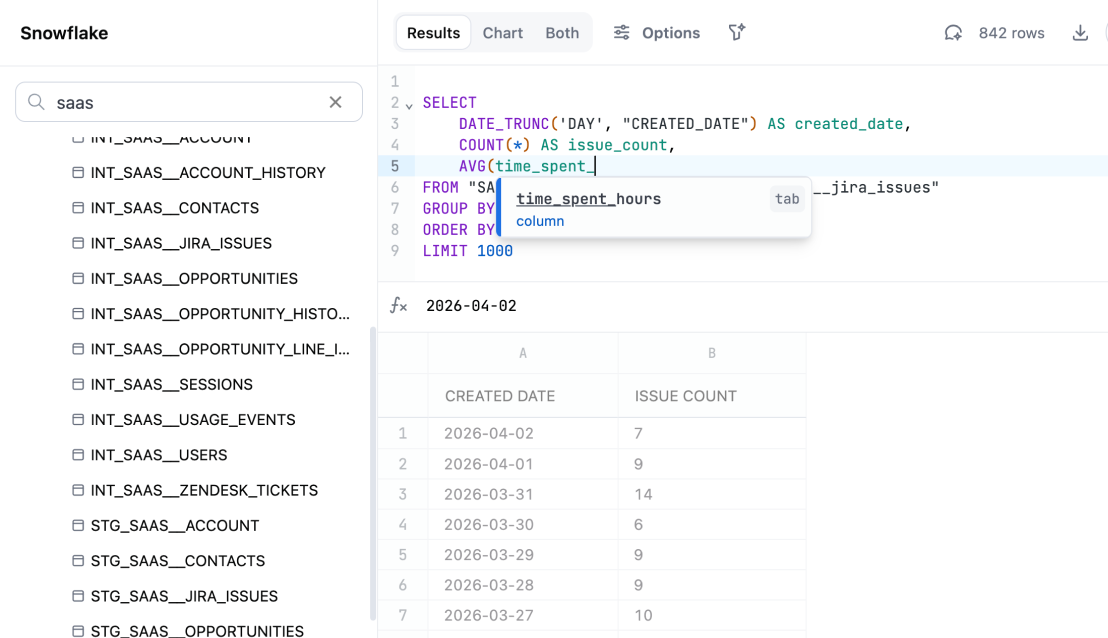
SQL
Drop into SQL whenever you need it. Write custom queries alongside modeled data, mix and match approaches in the same workbook, and hand off to engineers or data scientists without switching tools.
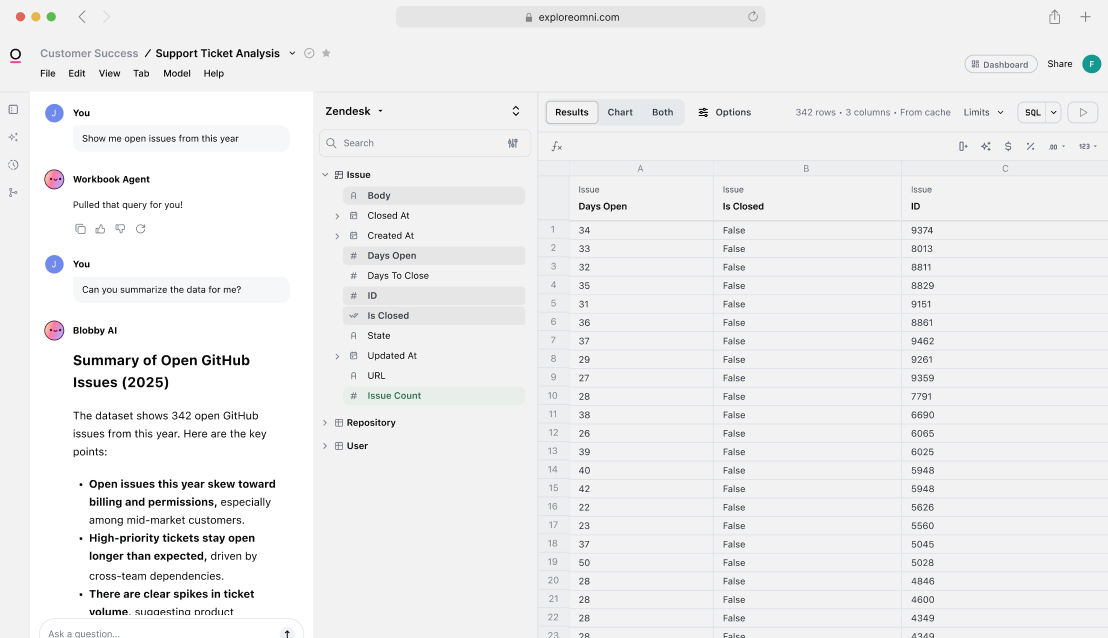
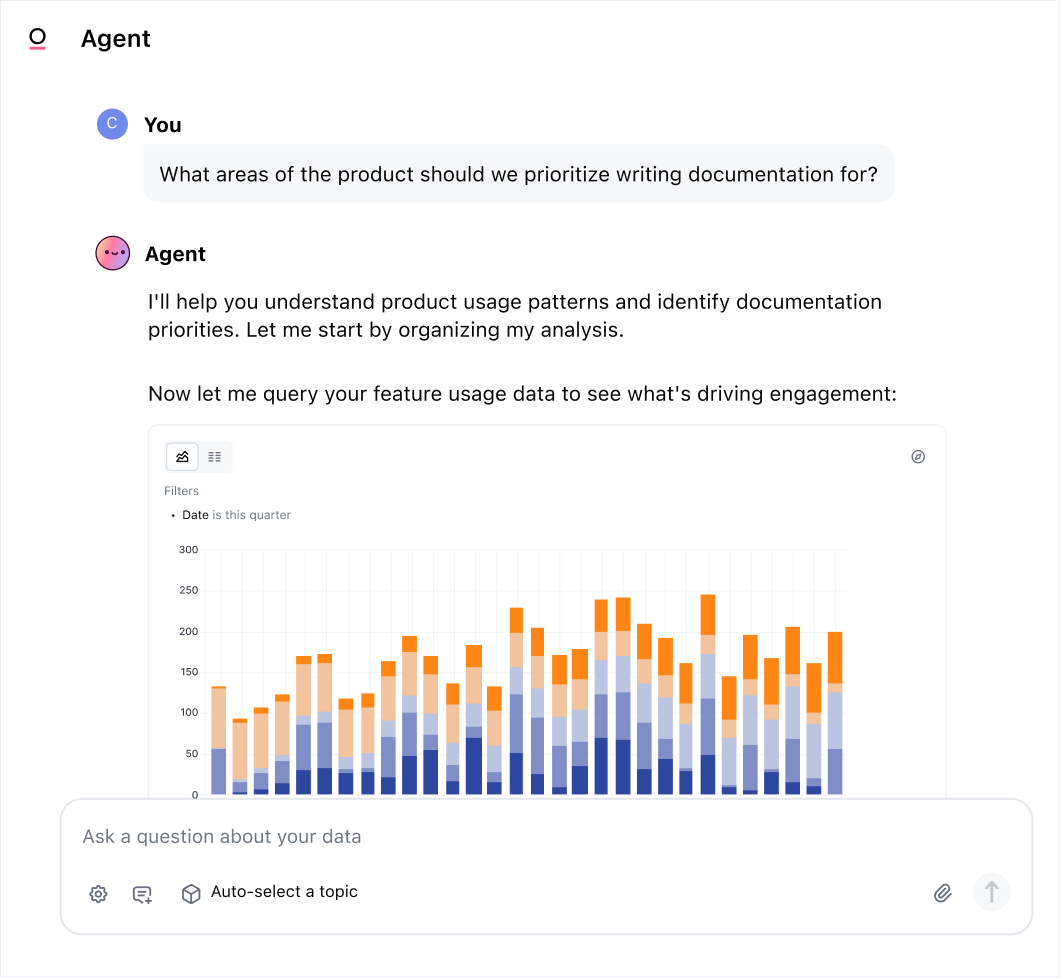
Workbook Agent
Ask a question, get a full analysis. The Workbook Agent writes queries, builds visualizations, and surfaces insights — so you can go from a business question to a polished workbook in seconds, not hours.

Dynamic dashboards help us track the pulse of the business and the ad-hoc workbooks help us go deep without needing to bounce between tools. The trust and speed we get removes friction, saves hours, and empowers everyone to make informed decisions which shows up in how quickly we align and act.- Kyle Turadek, Senior Director of Growth & E-Commerce
Real spreadsheets on live data
Build models and run calculations on governed data — in the spreadsheet format your whole team already knows.
Learn more →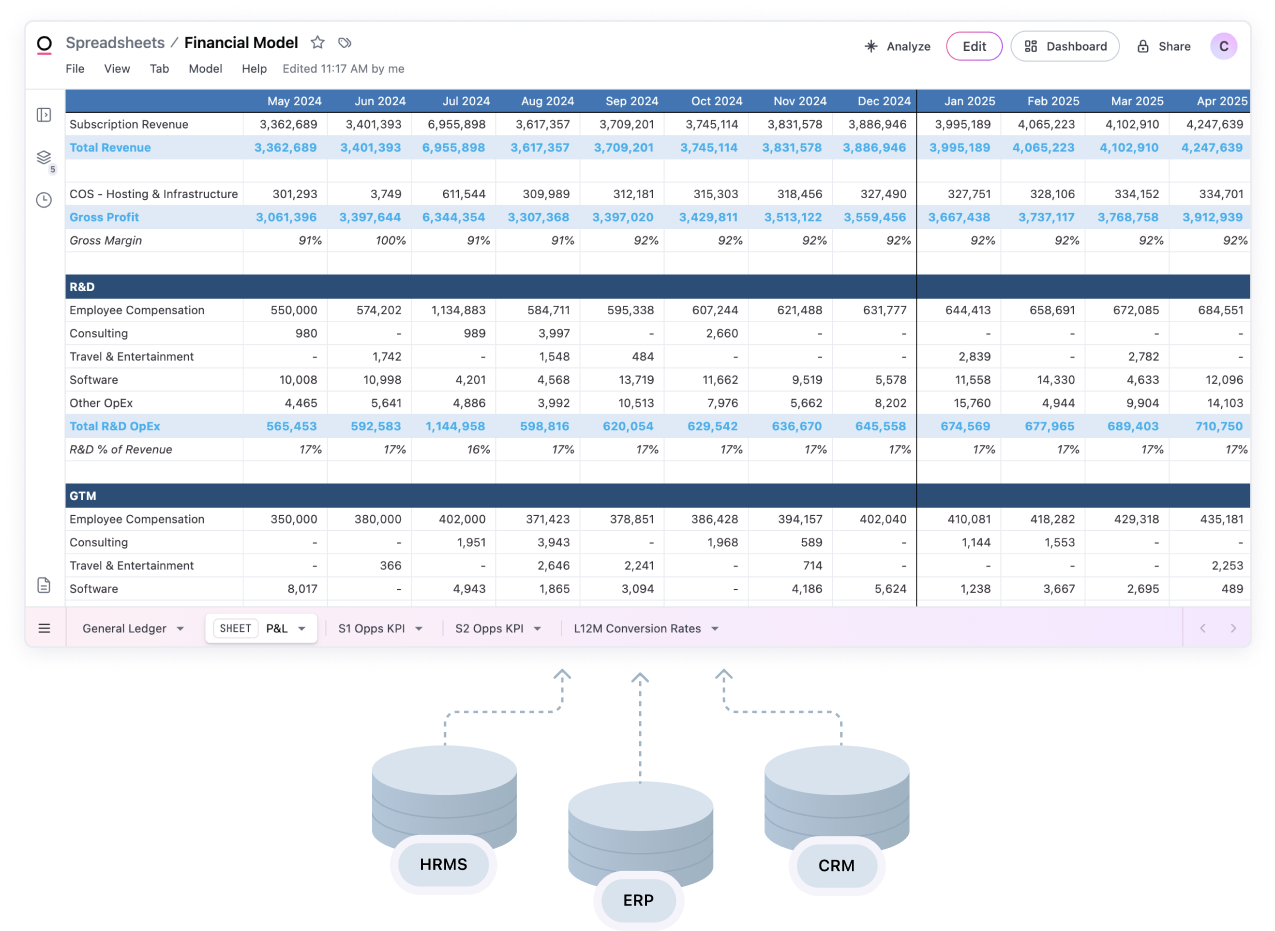

Spreadsheets have been a total game changer for our ARR reporting. It feels like Excel, but it's fully connected to our live data. We no longer have to download data in order to analyze it how we want to, and we can keep reporting consistent, which has been a huge help to stakeholders.- Laura Knipe, Staff Data Analyst, Sales & Finance

Receiving emailed reports and alerts has been key to our workflow for years. With Omni, we can add more data into those reports to alert us about changes or issues that need attention. It's much easier to monitor our product when everything is in one place.- Lizzy Bradford, Senior Director of Analytics

I had experience with semantic layers, but modeling in Omni is so much faster and lighter. Other tools make data modeling feel like extra work; Omni makes it part of the workflow and opens it up to business users so they can add business context only they know.- Edward Mancey, GTM & Ops Data Lead
Want to build analytics for your customers?
We do that, too 😉 Learn more about Omni's embedded analytics →