I started working with customers years ago as a member of Looker’s Department of Customer Love (DCL). The customer-focused philosophy shaped how I view customer success as well as how I evaluate companies. At Omni, we put those same principles into practice with every customer, every day. Colin, our CEO, is in every support channel responding to questions in seconds. We care deeply about making customers successful – from how they use the product to advising on data strategy – and keeping this bar high as we continue to grow.
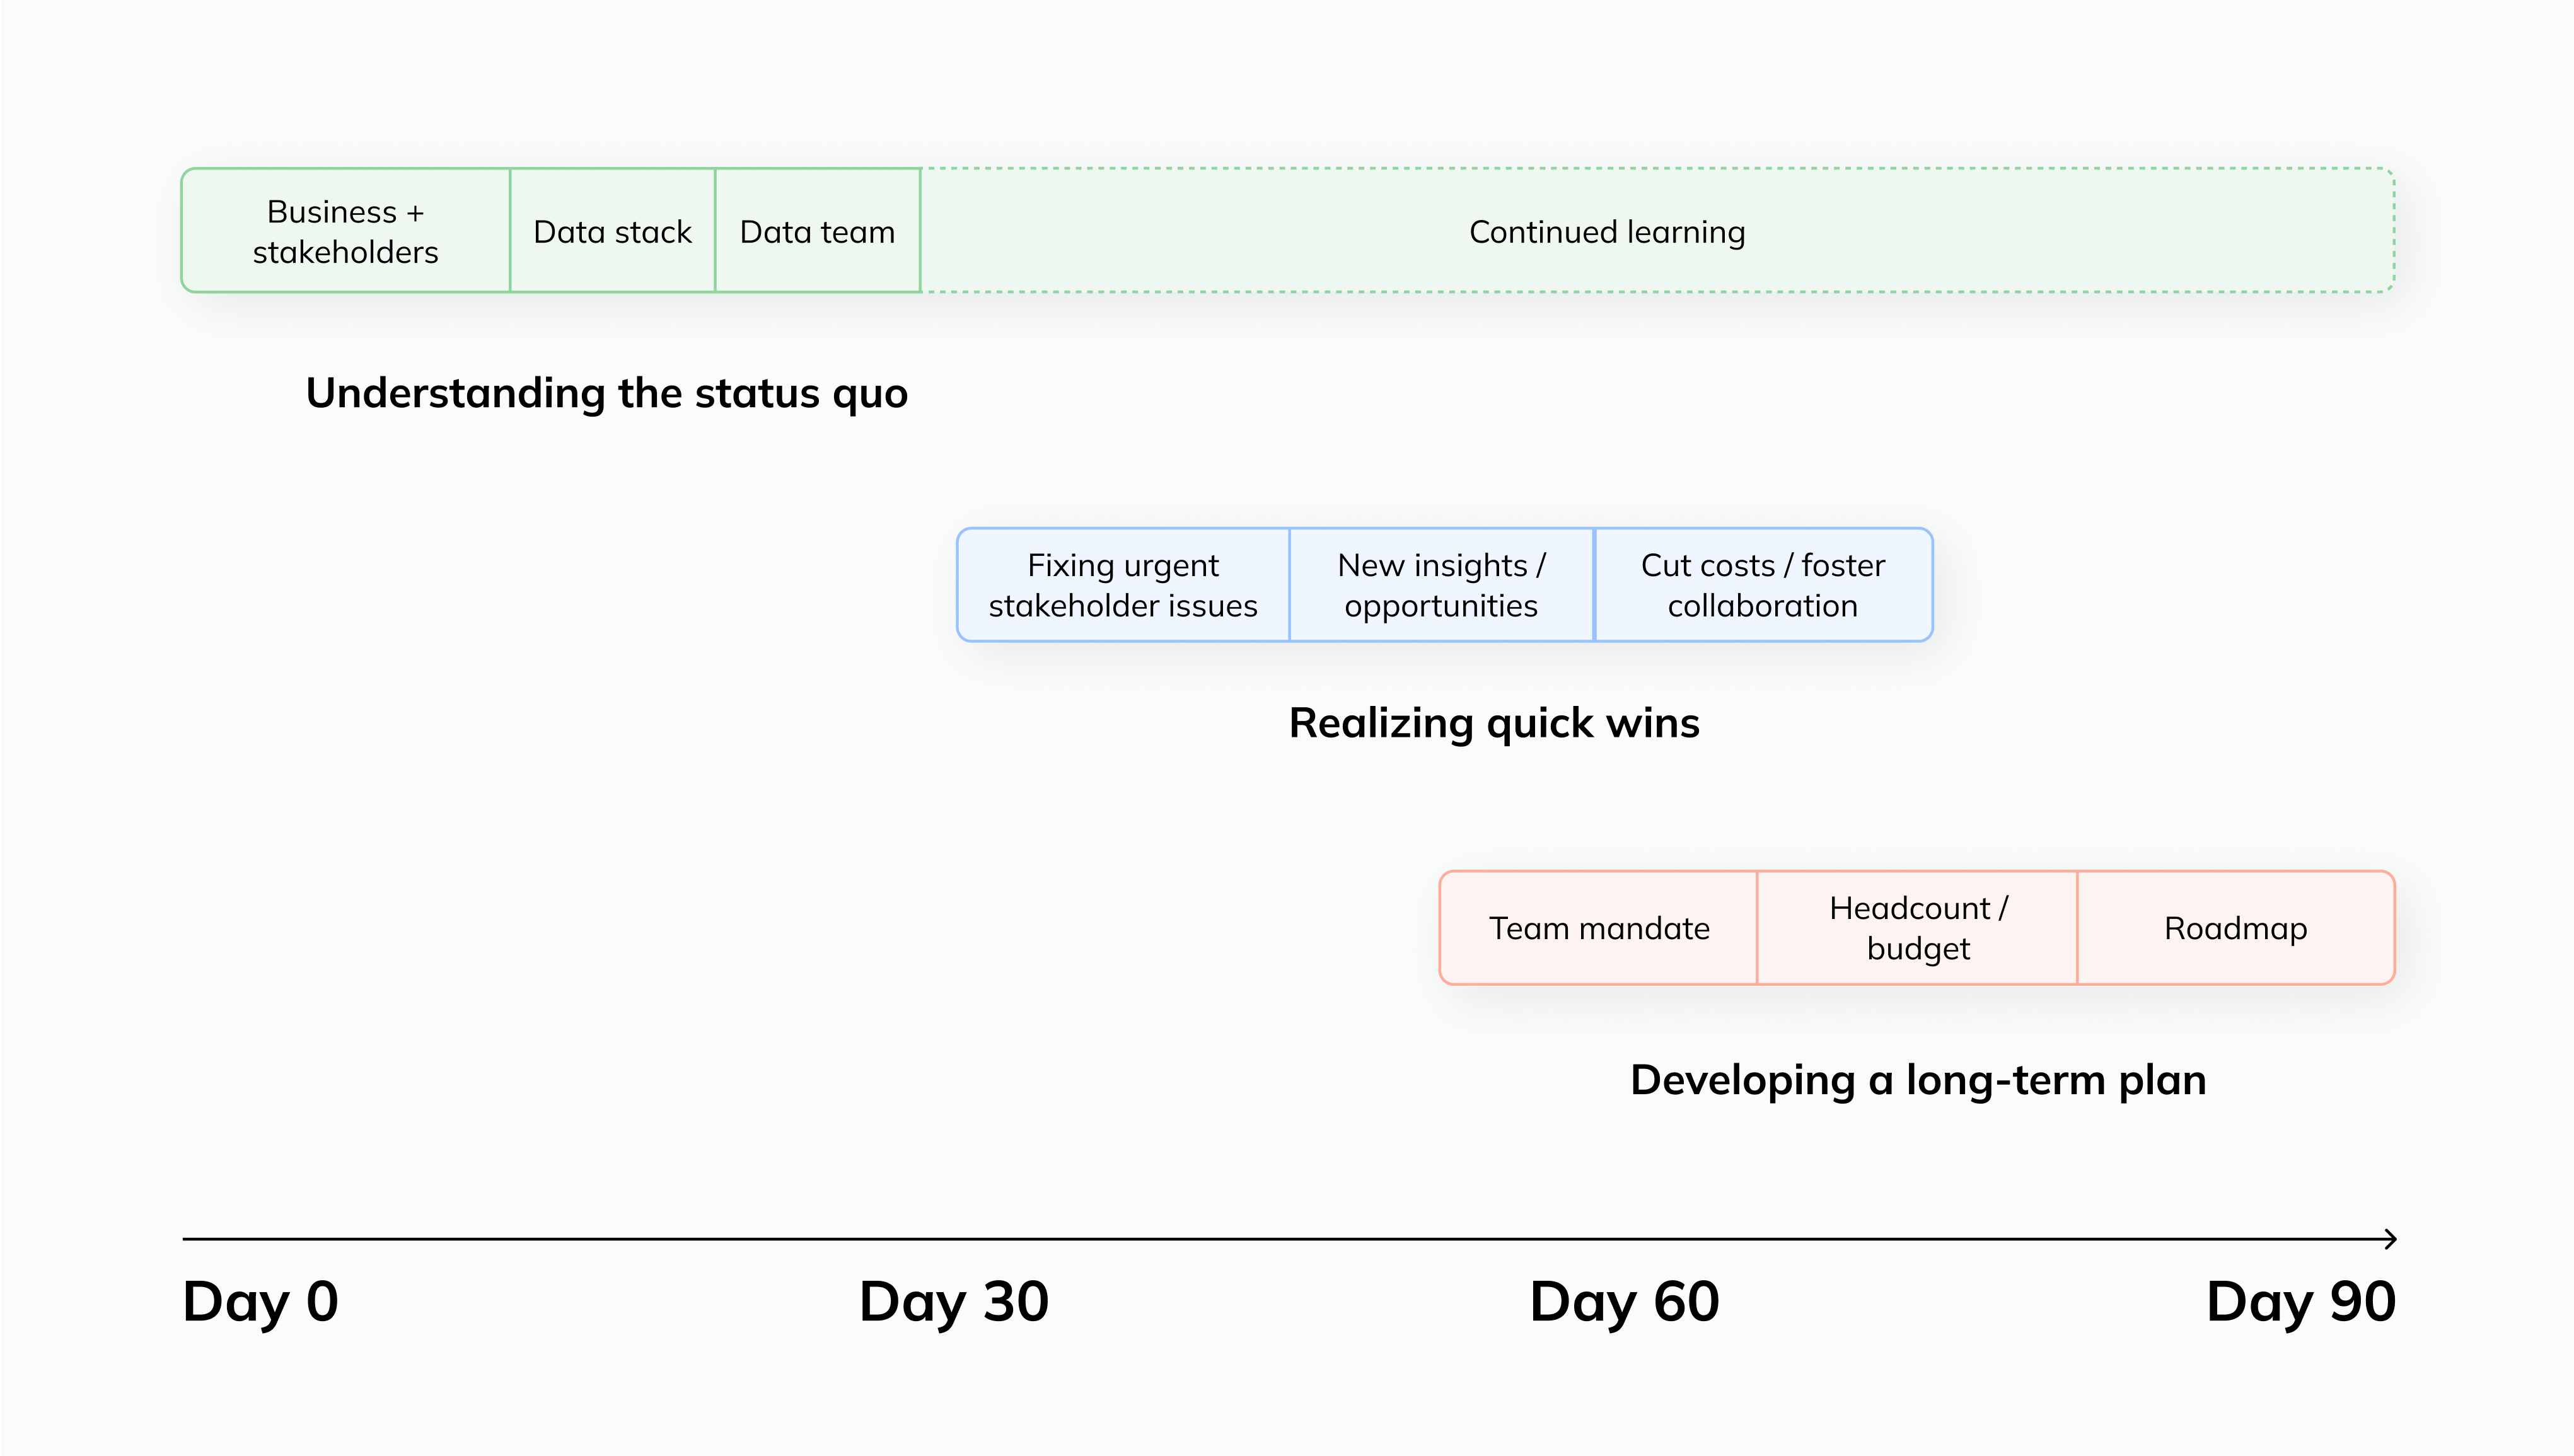
Recently, I set out to build our V1 of a customer health score to help us develop a common understanding for measuring and learning from our customer experience. Here are some of the questions I asked when I first joined Omni to support our growing customer base, which turned into the foundation for this project.
Who are our most successful customers and why?
What should I be doing to ensure customers onboard successfully?
What customers might need more support to be successful?

Why customer health scores matter #
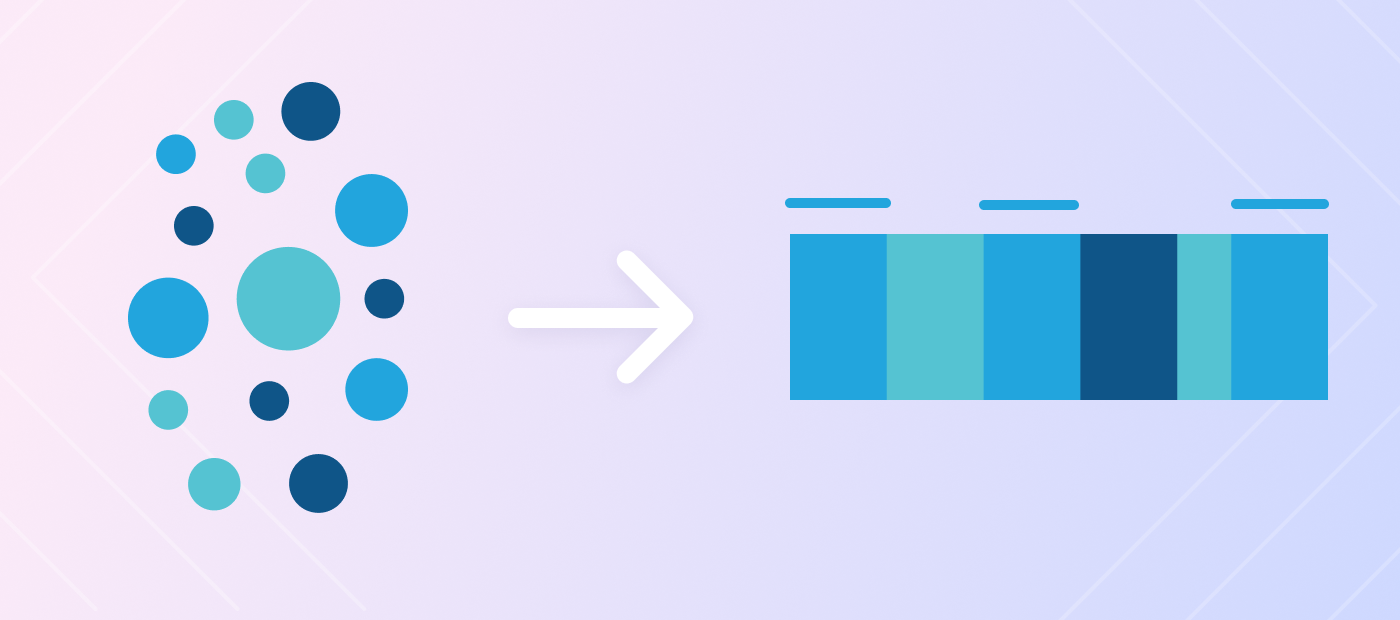
A customer health score is a single number representing how “healthy” or engaged we believe a customer is, and the value they are getting out of our tool. It allows our team to easily understand (from an increasingly long list!) how customers are doing, which customers we should spend more time with, and specific areas where we can make a bigger impact.
Beyond the Success team, it creates a common language across our company for how we think about our customers and what’s important for us to monitor and optimize. For our Product team, this means understanding which features healthy customers are using and prioritizing improvements and new features that increase engagement. These “healthy” customers might also be great beta testers. The Sales and Marketing teams might ask them for customer references and whitepapers. And so on. The goal is to rally our company around a shared framework and goal for how we want customers to use our product.
Defining a “healthy” customer #
When I first went down this path, by far the hardest part was defining “healthy”. It was easy to get paralyzed by all the options and spend too much time trying to get it perfect. After I spent a few days staring at my screen, trying to remember how to write predictive models and bashing my head against the computer, I decided to throw that all out. I started small, picked a handful of metrics, and just began looking at the data.
It was most helpful to think through what matters:
What do our most engaged users look like? What are they doing day-to-day?
What makes a customer successful in our product? Or what patterns are our most successful customers doing?
Why are customers using our product vs. others?
The general buckets we came up with (which may or may not be relevant to other SaaS companies) were:
Overall usage: We want customers to interact with our product and incorporate data within their day-to-day workflows.
Breadth of usage: The most successful customers are building a culture around data, and actively sharing data between users.
Depth of usage: There are specific features we believe are indicators of success.
The process for creating a health score #
Ultimately, the goal is to get to a single score, from 1-100, indicating how “healthy” each customer is. Once you have that single score, I recommend finding ways to share it and build it into everyone’s workflow. For example, our team uses Omni to surface health scores on dashboards, embedded in Salesforce, and via email for everyone to use in daily workflows – whether they’re on Customer Success, Product, or Marketing.
Getting to the stage where you have that single score and dashboards may feel a bit overwhelming, so I’ve outlined the steps I took below. While the metrics you look at and what you consider a “healthy” customer will likely differ, I hope this helps at least outline the process for anyone stuck in paralysis (like I was 😅).
High-level steps for creating a customer health score #
Define a healthy customer at your company
Create concrete metric definitions
Determine thresholds of each metric for healthy/unhealthy behavior
Decide what’s most important and assign weight to each metric
Combine into a final score
Continue to test and iterate
Harden the data model
Visualize and distribute
It all boils down to: try, test, iterate.
Next, I’ll walk you through a more detailed view of my journey along these steps.
Step 1: Define healthy #
As described above, I thought about what makes our customers successful. Depending on your business, this may cover their overall usage as well as the breadth and depth of their usage.
Step 2: Define metrics #
Once I had the general buckets of what made a customer healthy, I started brainstorming specific data points or calculations I could create that would encapsulate those behaviors. Again, this is going to be different at every company, but I’ll walk through examples of some of the metrics I used.
Overall usage
Total usage: For Omni, this might be minutes in the app or number of queries run.
Percent change in usage, period over period.
Breadth of usage
Percent change in active users, period over period.
Concentration of usage: Is the majority of usage done by a small number of users? Or is it more equally spread out?
Depth of usage
Are they using X feature? Y feature? For Omni, we defined which features we feel indicate a successful customer (e.g. scheduling queries).
A couple of notes and tips:
Be clear: To borrow from Lloyd Tabb, the best metrics are clarity metrics, not vanity metrics.
Start small: While there are probably an unlimited amount of metrics that might be interesting (and it’s tempting to use them all), it’s much easier to start small and build from there. Try choosing just a handful of the strongest behaviors you want your customers to emulate.
Do what feels right for your business: I spent a while thinking about what timeframe made sense to use. I ultimately ended up doing my calculations at a rolling 28-day window because one month felt like too long (by the time we saw the new score, we were already a month late to react) and week-by-week felt too short (there was too much variability that created a lot of distracting noise). Rolling 28 was more work up front but worth it.
Step 3: Determine thresholds #
Now that I have the metrics defined for each component that will make up our health score, I was ready to determine what healthy vs. unhealthy behavior looks like for each metric.
One of my favorite parts about using Omni is that it makes it easy to explore the data, prototype definitions, and iterate. Since I defined my calculations above in Omni, I could quickly bin the metric fields and play around with different buckets to find a threshold that had a desired distribution.
Below is an example of bucketing using the Percent Change in Usage (Period over Period) metric I calculated in the previous step.

Ultimately my binned calculation might look something like this:

You’ll notice that this feels a bit arbitrary – it is! I made these with the expectation that they will very likely change over time. We’re looking at health score as a framework for understanding customer behavior, not a prediction of churn or renewal. The actual score doesn’t matter as much as the relative score and indicators that make it up.
Step 4: Decide metric weights #
I then wanted to include some notion of the relative importance of each component to the overall score (e.g. in our situation, did overall usage matter more than a customer using a certain feature of a product?). Depending on your product and metrics, each component might be equal weights – or not. For me, they were mostly equal, with one or two being slightly more important.
Step 5: Combine into a score #
For each component, I then created a score (based on the thresholds and weights decided above) and then combined all the individual scores into a total overall health score.
To walk through an example, let’s continue to look at the Percent Change Usage field.
I assigned this metric a total possible score of 3 and then broke down scores based on my thresholds. This ultimately looked like this:

I did this for each component of the health score and then created the final score by adding these all up and dividing by the total possible points (in the below example, 20):
Step 6: Test and iterate #
While I hoped to make this process look easy, in reality, this took many tries to fully bake out.
Throughout the development process, I iterated and tested each part over and over again. I changed the calculation of a metric, switched up the thresholds, and redid the time periods for calculations…until I had a score that felt right. While the process was more time-consuming than I hoped, my biggest challenge was just taking the time to test things thoroughly until they felt right.
Step 7: Promote and harden the model #
Once I felt good about the scores, I promoted the “finished” model (finished in quotes, because I fully expect this to change over time) so that the rest of our company can start to leverage them.
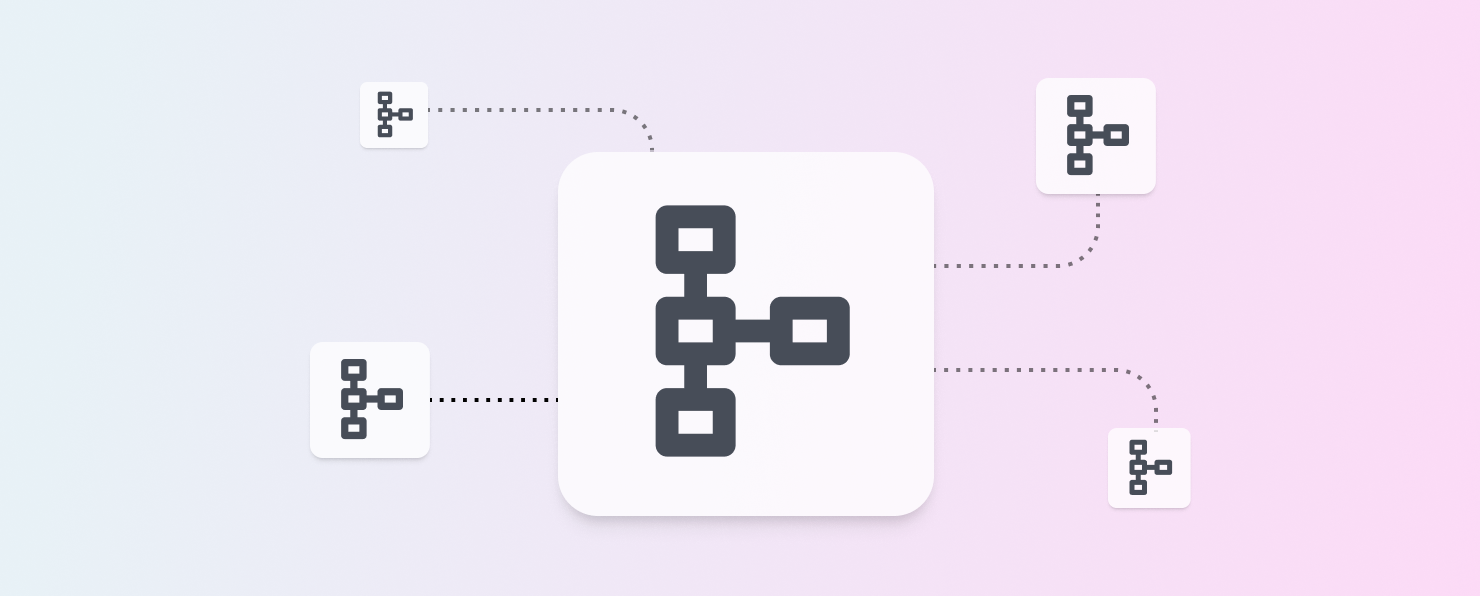
One of the interesting challenges I’ve seen customers face over and over again throughout my time in the BI space is where to do your modeling. Is it in the database? In a tool like dbt? In the BI tool? For customer health scores, I ultimately decided on a hybrid approach using a combination of Omni’s layered semantic layer and dbt.
My initial base metrics (e.g. rolling 28-day usage) relied on heavy transformations and complex SQL logic. Given the performance implications and the fact that these were going to be relatively stable and widely used, I pushed the calculation logic from Omni into our dbt pipeline.
The thresholds, weights, and overall health score calculations made sense to promote to Omni’s shared model. This way our whole company can leverage these scores in future workbooks and dashboards, and we have the flexibility to continue to iterate quickly and easily over time.
Finally, I chose to keep some of the logic that was specific to my dashboard (e.g. some formatting logic) in the workbook model, that way it didn’t bog down our shared model.
Ultimately, (at least for V1) our architecture looks something like this:

Step 8: Visualize and distribute your work! #
Finally, I made a few polished dashboards that live on our internal Omni homepage because our entire company really does rally around these scores and our customers.
In the past, I’ve found a single overall health score, while incredibly useful, can also feel like a black box if people don’t know how it’s calculated. So on our dashboards, I broke down the components that go into the health score as well as linked to documents that outline the process. I think this helps folks answer inevitable questions about what goes into the metric as well as trust and take action on the metrics - no guessing needed!
Ongoing success #
This is a continuous process. While the maintenance of this score and dashboard is low because of Omni’s underlying data model (e.g. when we have new accounts marked as ‘customers,’ they’re automatically tracked here), how we define “healthy” will change. Our number of users and how they interact with the product will continue to evolve, we’ll think of new facets to add to our scoring, and we’ll build new ways to integrate this into our workflows as our team continues to grow too.
But, the one thing I know won’t change is our value of keeping the customer experience bar high. So if you find yourself in a similar position and you need to create your first customer health score, don’t be surprised if it’s never completely crossed off your ‘to-do’ list, and that’s okay!