As the cloud infrastructure person at Omni, it’s my responsibility to make sure that we use our AWS resources in a cost-effective way. It’s great that we spend money on building a fast and reliable platform for our customers, but it’s not okay to waste money on resources that we aren’t using or getting full value from.
AWS makes it easy to provision cloud infrastructure with a few clicks or lines of code. However, every piece of cloud infrastructure comes with a cost, and it isn’t hard to accidentally spend (sometimes, a lot) more money than intended.
Earlier in my career a co-worker of mine (really – I promise, it wasn’t me) built a cool new feature using AWS that our customers loved. As a good developer, they put a lot of effort into making sure that the new feature could scale up to meet the needs of our customers as we grew. The feature worked out wonderfully, but we had a bit of a shock when the AWS bill came in later that month – our overall AWS costs had doubled. Turns out my coworker had forgotten to spin down the servers they’d used to load test the feature, which resulted in additional AWS costs of thousands of dollars.
Anyone working in cloud computing probably has a similar story. Learning from this experience (and many others), I set out to create an AWS cost monitoring dashboard to display our cloud costs across a variety of dimensions so I would have all the tools needed to identify trends in our spending, determine where our money is going, and maintain efficiency for our budget.
There are a variety of tools that slice and dice AWS spending into reports and charts. AWS itself includes AWS Cost Explorer, which is good but pretty limited. I also looked at a variety of 3rd party AWS cost analysis tools, but decided to build out the reporting myself. Why? Turns out, I work for a business intelligence company with a product built to analyze data 😀
Going from raw AWS cost data to an actionable dashboard #
Step 1: Export AWS cost data into Amazon S3 #
We use Snowflake as our data warehouse (though any data warehouse or database would work just fine for this). So, first, I needed to figure out a way to get our AWS spend data into Snowflake. Since Snowflake provides a mechanism for loading from an S3 bucket, I set out to get the spend data into S3.
Luckily, AWS has a feature, AWS Cost and Usage Reports, that does just that – exports cost and usage data to an S3 bucket. They recently added some great new features to the cost and usage data export, which are incorporated into the process I’ll outline below.
Configuring the data export wasn’t all that hard following the directions in the documentation. That said, here are a few items to consider if you set out to implement this for yourself.
Tips for exporting data from AWS
Be sure to choose the “Standard data export,” not the “Legacy data export” – no reason not to use the new features!
I chose not to include resource IDs or to split cost allocation data. For my purposes, it was overkill, but may be worth exploring depending on your needs.
I chose Daily granularity; Hourly seemed like overkill and Monthly wouldn’t have given me the detail I needed.
I chose to include all the available columns, figuring it was better to have all the data available. However, I can see an argument for cutting down on the columns included in the output to reduce some of your data storage costs.
I chose gzip compression, though both gzip and parquet are built into the Snowflake file format, mostly just so I could easily look at the data on my laptop to understand it better.
🚨 This one is important 🚨: Choose to “Overwrite existing data export file” to have a single definitive file to import into Snowflake for each time period. Without that, you’ll get duplicate entries as Snowflake imports every file, not knowing that one file supersedes the others in the time period. If you want to be able to track changes, turn on “file versioning” on the S3 bucket to keep old versions of the files as they are overwritten.
By default, you’ll only get data starting with the current month. Assuming you want historical data, you’ll need to open a support case and request it. Note that as of the time I’m writing this, AWS is unable to backfill the new v2 reports. Hopefully, they’ll be able to do that soon. Until then, you may want to create a “legacy” report if backfilled data is important to you.
As an aside, I had previously set up AWS Cost Categories to tag resources with additional data. In our case, I added a tag to categorize by Omni environment (e.g. our production environment, testing environment, build pipelines), so that we can report on the costs of each environment. If and how you categorize will depend on what makes sense for your company. For example, I know that many (bigger) companies categorize costs by business unit or by department. The cost category data is automatically included in the output of the cost and usage reports (which is great), but it doesn’t go back in time (not so great). So, I highly recommend setting up cost categories as soon as possible so you can start building up the data immediately.
Step 2: Get that spend data into Snowflake #
Snowflake has a built-in capability for loading data from an S3 bucket on a schedule. The Snowflake documentation walks through the steps, but here’s the high-level approach I took (with a few tips):
Create a Snowflake S3 storage integration: I chose to create an S3 Storage Integration since it’s the recommended option…and because I really hate having to create and maintain IAM users and credentials.
Create a Snowflake file format: the important thing here is to match the settings chosen for the data export above (e.g. gzip or parquet, csv or parquet)
Create a Snowflake S3 stage: use the storage integration and file format you chose in the prior step
Create a table for cost and usage data: the trick here is getting the schema. I used the INFER_SCHEMA feature of Snowflake, but you can benefit from my experience by using my schema in GitHub.
- Create a Snowflake task: this runs SQL on a schedule to pull data from S3 and put it into the table. I went for the simplest approach of truncating the table and loading all the data from S3 on each run. This was just to try to make sure that the data is in sync between AWS and Omni in the event of any error corrections or other changes.
** Note the
PATTERN='.*.gz'tells Snowflake only to load the gzipped files and theFORCE=TRUEtells Snowflake to load every file even if it was already loaded. Once the task is created, don’t forget to “resume” it so it will run when scheduled.
While this approach is Snowflake-specific, most data warehouses should have similar functionality. Alternatively, you can load data via ETL tools, like Fivetran.
Step 3: Analyze and monitor with your BI tool (in my case, Omni 🙂) #
At this point, I was finally in a place where I could start exploring the data. We already have a Snowflake connection, so I only needed to refresh the schema to see the new table in Omni. From there, it was time to create a new workbook and do some analysis.
The first thing I noticed was there are a ton of columns in the AWS Cost and Usage Reports export – 125 to be exact! Definitely a bit overwhelming. While AWS provides a data dictionary to describe each column (it’s indispensable when trying to decipher what’s going on), here are some columns that I found useful:
Core columns
Date = line_item_usage_start_date: start of the granular time period. Since I chose Daily granularity, this is the date of each charge.
Cost = line_item_unblended_cost: this is the cost of the line item (the reason I went through all this in the first place 😅). I did a
sumon it to get totals per date, account, region, etc.
Columns to group spend by
AWS Account Name = line_item_usage_account_name: we have multiple AWS accounts, so this was important for breaking down spend by each account
AWS Service = product: e.g. EC2, S3. Note that this is a JSON field, so you’ll need to drill down to “product_name” to get the AWS service. Using Omni made it simple to parse the JSON field.
AWS Region = product_region_code: e.g. us-east-1, us-west-2
Cost Category = cost_category: if you set up cost categories as described above, they will be in this JSON field
If you have a data model, this is a good time to check and do some housekeeping to keep things clean. Things like renaming columns to be more legible, hiding columns that aren’t applicable, drilling down into JSON fields, adding measures, etc. In Omni, I can still analyze unmodeled data directly from Snowflake without doing this work, but as I go, I can make the information more usable for others.
Here are a few gotchas and tips I found while working through the data.
Tips for working with the AWS data export
Validation: While working through the data, I compared the results to the reports in AWS Cost Explorer to make sure that the totals matched up. This saved me a few mistakes (see the next few bullets) and gave me confidence that the data load was successful and that I was looking at the correct fields.
Regions: Some resources aren’t associated with a region, so the region value may be “global” or blank in some cases. If you’re filtering by region, be careful and include global and blank when applicable.
Time zones: I needed to set
convert_tz: falseon the date fields in the model to avoid timezone conversion and make sure the dates matched the AWS data. ** Note, if you’re trying to work with timestamps and time zones in different databases, check out these tips from my teammate, Jack.
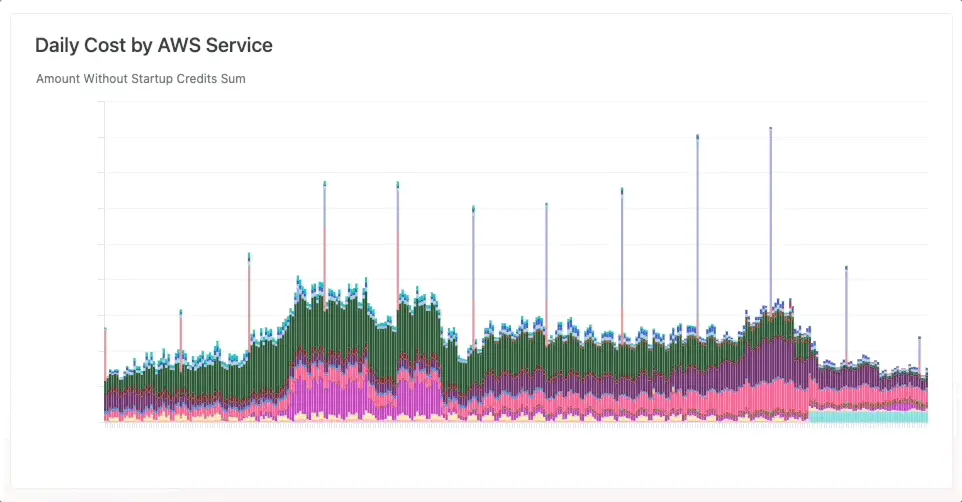
With that, I was ready to build a dashboard. As a first pass, I built four charts:
Daily Cost by AWS Service
Daily Cost by Omni Environment
Daily Cost by AWS Account
Uncategorized costs (meaning no cost category was assigned)
To make sure I was continually monitoring for surprises or things we could improve, I set up a schedule to send the dashboard to my email every weekday at 9 am. This helps alert me if there’s a spike in our spending from the previous day, so I can dive in to see what’s going on before things get too expensive. I’ve already found a few situations where costs unexpectedly jumped, and this helped me address them long before the monthly bill came in.
In the future, I plan on diving deeper into the data we currently monitor and expanding to add new things to monitor. Exporting this data from AWS and exploring it in Omni also allowed me to combine the AWS data with the other data in our warehouse and get more insight into our AWS usage in the context of the company. Next up, I’m going to be digging into analysis like cost per tenant and how AWS usage changes after releases.