Like any other finance person, I have had at least one Excel window open on my desktop for my entire career.
Recently, I swapped some of those Excel tabs for Omni spreadsheets — and I’ve been surprised by how much it’s helped my workflow. For our customers, I’m excited to share that spreadsheets are now GA, so you can use them in your reporting as well. And if you’d like to see how we use spreadsheets in practice, join us for a LinkedIn Live later this month.
I still love Excel. The most tech-savvy amongst us take pot shots at it, but Excel is an undeniably fast, flexible, and powerful tool. Everyone uses it — from the dinner bill splitter, to the VLOOKUP dabbler, to the investment banker who never touches the mouse, and at the extreme, the competitors at the Excel World Championships (yes, that’s a thing).
But Excel also has some major shortcomings.
Stale data = repetitive work - I’m constantly downloading and pasting the same CSVs from our HRIS, ERP, CRM, and other tools, then repeating that process when it’s time to update charts or prep the next board deck
Data modeling that doesn’t scale - Workbooks can quickly become unruly when you need to model mission-critical metrics like ARR, CAC, and LTV across cohorts, segments, and hundreds or thousands of customers
Version control and access constraints - I can’t count how many times I’ve sent a Model_vFINAL_v2.xlsx to the VP of Sales who opens it in Google Sheets, only for the formatting to be messed up and the results to already be outdated
Like most folks, I was content living with these issues. No one needed to “fix” Excel.
Then I joined Omni. I was excited to use Omni as my BI tool, but I didn’t imagine it going further than that. Once we started layering actual spreadsheets into the product, though, I started to see that my financial models and reports didn’t have to be static. They could be built on live data, governed, and repeatable – and I could actually do a lot of my core financial work in Omni.
In this blog, I’ll share some examples of how I run finance from Omni today and explain how it’s changed my workflows for the better.
Building our financials in Omni #
As our VP of Finance, I use Omni for a variety of things today:
Income Statement, Balance Sheet, and Cash Flow Statement — all built from our general ledger data
KPI dashboard with metrics like net dollar retention, CAC payback, burn multiple, and ARR per employee
Drilldowns like headcount and CAC contribution by department (marketing, sales, sales engineering)
ARR overlays pulled directly from Salesforce and layered on top of our GAAP financials
Board deck outputs — the same metrics we present each month, now automatically refreshed
Since I'm not particularly keen to share my actual reports with Omni's financials 😅, here’s instead a video from my teammate Conner walking through some similar reports we’ve created on demo data:
The result is something that feels just like Excel, but has the benefits of BI: speed, consistency, and centralization.
A familiar interface, now built on live data #
It was surprisingly fast to get up and running. In Omni spreadsheets, I can structure financial models the way I’m used to: using Excel formulas and shortcuts, range names, referencing data from multiple tabs, applying formatting, and more.
Underneath, though, there’s a big difference.
In Excel, once you upload data and start working with it, it’s already stale.
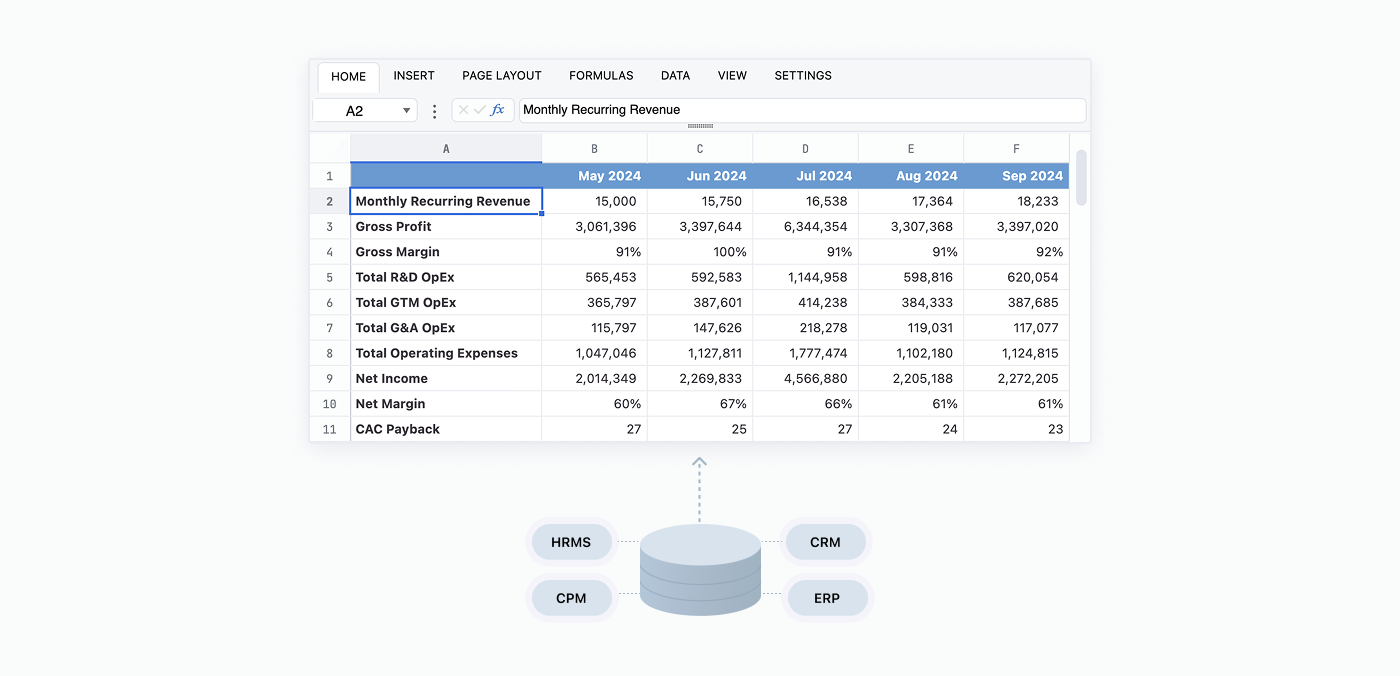
In Omni, I’m building directly on top of live data instead of uploading CSVs. Our real-time general ledger data flows into my spreadsheet directly from our ERP. So do metrics like ARR from our CRM and headcount from our HRIS.
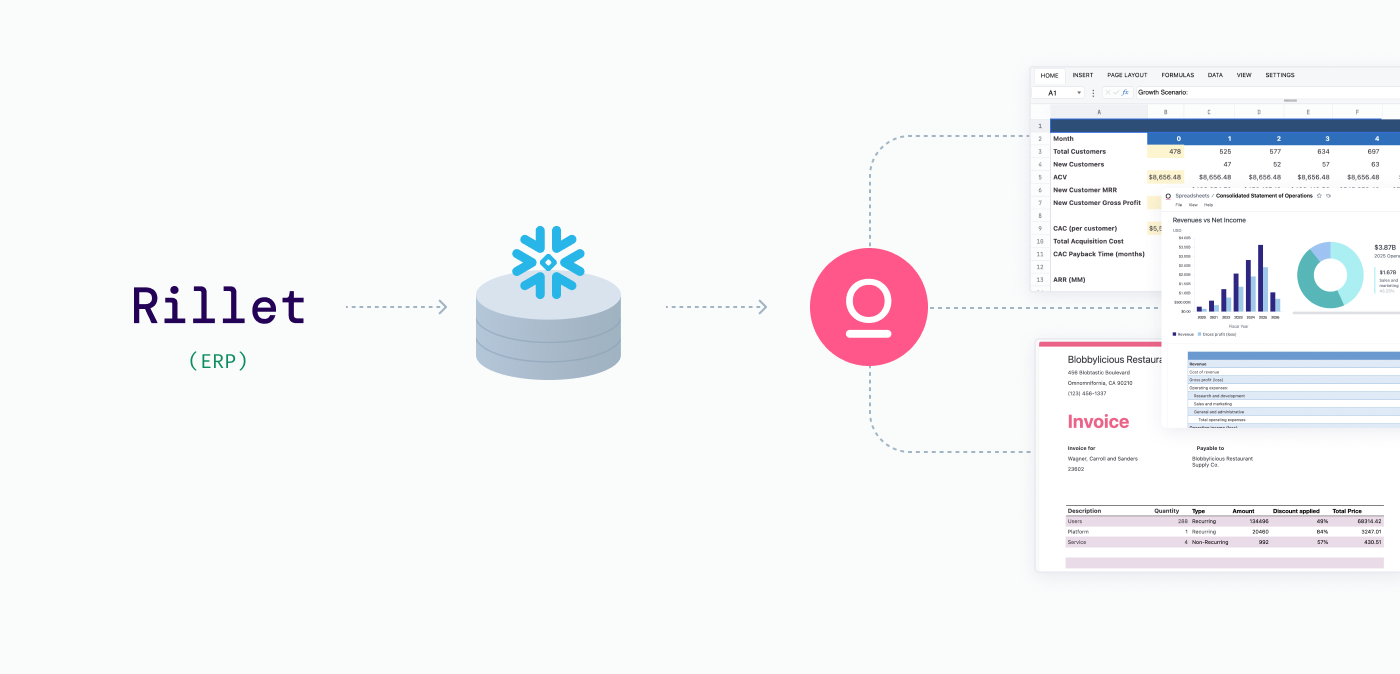
Our ERP, Rillet, helped us set up a Snowflake share for our general ledger data, which made it seamless to connect to Omni. The moment that data was live, I could start building financial statements directly on top of it — no exports, workarounds, or hacks necessary.
Instead of referencing static data in Excel, calculations run on top of my warehouse data. When something changes upstream, the model reflects it automatically, and downstream calculations change accordingly. I don’t have to re-download CSVs from multiple systems just to update my analyses.
This helps make the work we do in finance feel like it’s moving alongside the business, rather than waiting for the books to close:
I can share a link to our income statement with Colin (our CEO) right when the month closes instead of having to upload CSVs, drag formulas, and send a new Excel file.
When we close a new customer in Salesforce or process a bill in Ramp, I can instantly see how that impacts our P&L just by refreshing the page.
The charts we use in board meetings are visible in an Omni dashboard at any time, not just when they're being pulled for a meeting.
Consistent, trustworthy reports every time #
Financial metrics can get complicated quickly.
While it’s usually fastest to iterate on complex logic (e.g. ARR, CAC) in Excel, it also feels brittle, as if the logic might break when you upload new data or tweak the calculation.
With my reporting in Omni, I can lift out core pieces of logic and bring it into the BI layer for repeatability, without losing the familiar presentation of an Excel sheet. A good example is CARR (Contracted Annual Recurring Revenue):
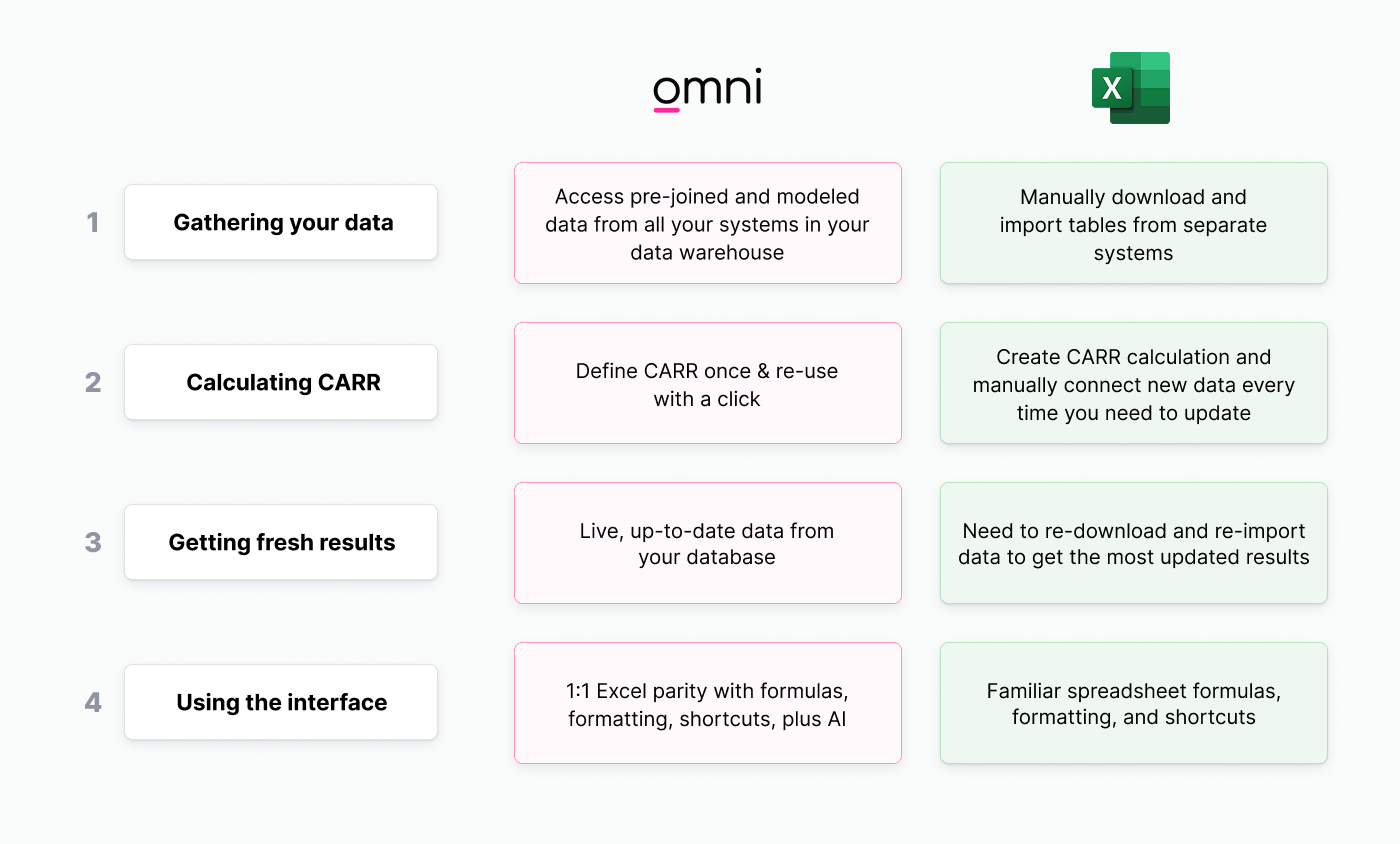
Calculating CARR in Excel: I’d have to manually download and import multiple tables from Salesforce, like Opportunity, Opportunity Line Item, Account, etc. Then, I’d need to calculate new business, expansions, cross-sell, contractions and churn using complex logic that references each of those tabs.
The next time I want to update my CARR reporting, I’d have to re-download and re-import each of those tables, even if the logic hasn’t changed. If the formatting or structure of any table has changed even slightly, there’s a high chance my calculation will break, and I’ll have to spend time fixing it.
Calculating CARR in Omni: I can leverage work done by Colin and RevOps, take advantage of pre-defined joins and metrics, then simply click the field to get a real-time view. If I want to iterate on top of it, I can just open the tab in an Omni spreadsheet and adjust things like I would in Excel. Plus, I know that the logic is consistent every time I look at it and I’m using the same definitions as the rest of the company, even as the underlying data is changing.
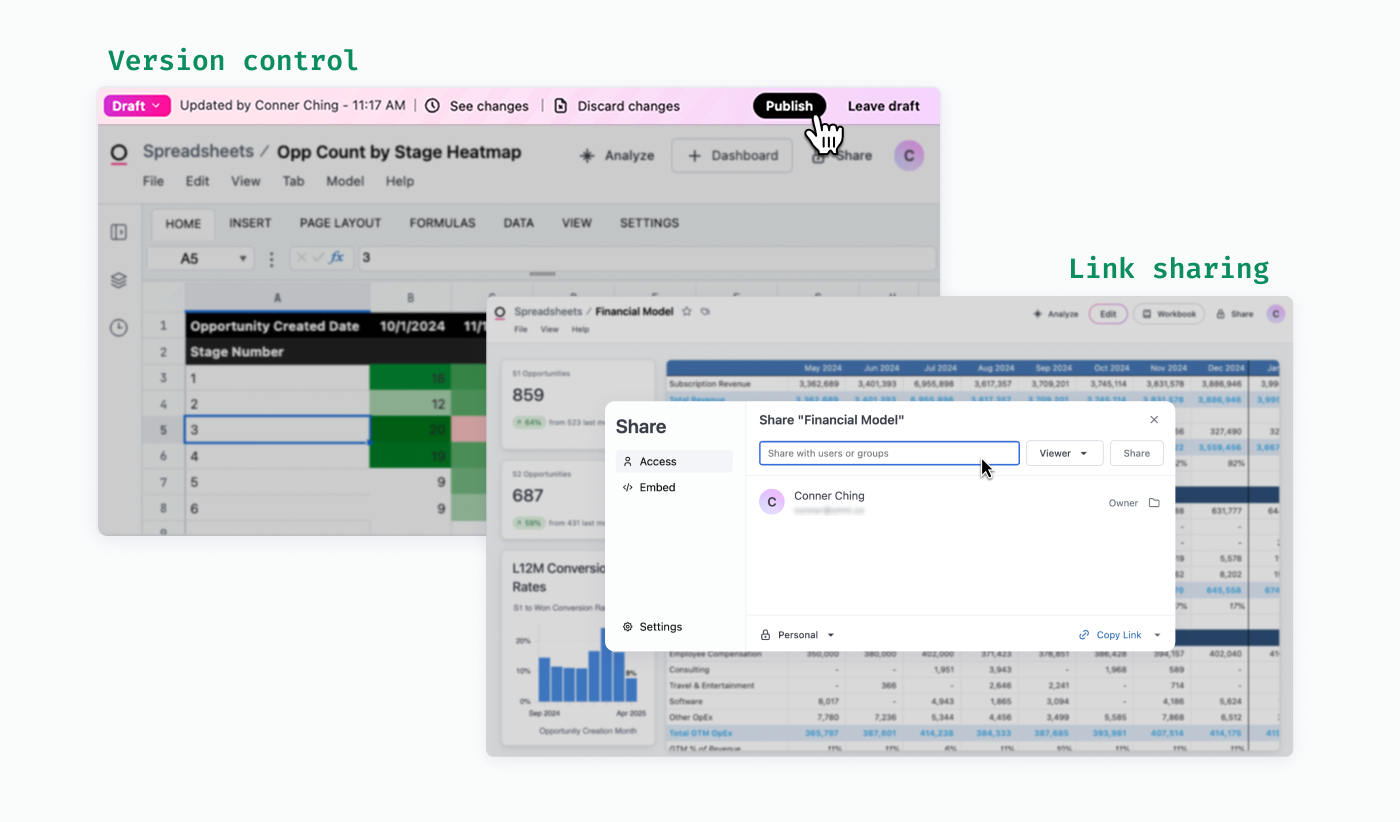
Omni spreadsheets also have built-in version control and live links. You can work in a draft, publish it when you’re ready, then share it via URL. Anyone who opens the link always sees the live version, instead of wondering if “Q1_sales_analysis_final_FINAL.xlsx” is actually… final.
We’ve heard from some of our customers, like Cribl, how moving some financial reporting into Omni help them keep key metrics consistent, while still feeling like Excel:
“Spreadsheets have been a total game changer for our ARR reporting. It feels like Excel, but it’s fully connected to our live data. We no longer have to download data in order to analyze it how we want to, and we can keep reporting consistent, which has been a huge help to stakeholders.”
Laura Knipe, Staff Data Analyst, Sales & Finance
A comprehensive view of the business #
Working in Excel also isolates financial analysis from non-financial data, even though both are necessary to understand the full picture of the business.
In Omni, I can see all business metrics side-by-side, since they all come from data in my warehouse. With spreadsheets, I can work with them and present them just as I would with Excel.
For example, we currently don’t split out revenue by region in our ERP. But in Omni, I can join ERP data to Salesforce data and easily segment my data that way, helping me get a deeper look at our revenue without having to export a bunch of CSVs across systems.
I’ve also brought in data for CAC payback, burn multiple, magic number, and subscription margin — all metrics that matter deeply to our board and our exec team, but typically require pulling from multiple tools (ERP, Salesforce, product data, etc.). Since we’ve already defined these metrics in Omni, I don’t have to rewrite complex formulas or hope they hold up as the data changes.
Our friends at South Shore Analytics shared how this has helped them meet their clients’ needs, too. In other tools, they’d have to do a ton of data wrangling to get the data in the right format, then use custom visualizations to build what their customers want. With spreadsheets in Omni, they can build the same thing in hours instead of days.
“Omni spreadsheets have been perfect for our client’s use case. We’re able to pull in data from different sources as workbook tabs, then reference multiple tabs in a single spreadsheet to build a complete picture of their business. We’ve never been able to do it this seamlessly in other BI tools.”
James Burke and Nick Lisauskas, Co-founders
More cool ~sheet~ to come 😉 #
There are still things I use Excel for, like multi-year forecasting. But for presenting real-time actuals, combining data sources, and driving monthly reporting, Omni’s spreadsheet functionality is more efficient and scalable.
And there’s still a lot more I have yet to play around with. I’m already using our Calcs AI to speed up formula writing, and as I get my bearings on the rest of our warehouse data, I’ve been using Blobby (our AI assistant) to start most of my queries. It’s been fun seeing how my bread-and-butter spreadsheet workflows come together with AI and BI, and I’m excited to see what other reporting I can bring into Omni as we continue to develop on this front.
If you’re a finance leader who lives in Excel, I get it. I still love it too. But if you’ve resigned yourself to constant imports/exports, stale data, and manual work, I’d encourage you to try out Omni and see how much of your workflow we can help improve.