Recently, I chatted with a few friends about the platforms we spend the most time on. A few joked, “X,” some admitted “TikTok,” and my finance‑savvy friend quipped “Robinhood.” I sheepishly raised my hand and admitted: Salesforce and Google Sheets.
I’m not ashamed — If you work in Revenue Operations or similar functions, you know the drill. You funnel data into a CRM → export a CSV → paste it into a spreadsheet → and then promptly enter “planning mode,” including attainment projections, headcount models, and revenue scenarios. I love the flexibility of spreadsheets, but here’s my biggest source of frustration: the moment you pull that data, it’s already stale. Our business moves fast, and decisions built on yesterday’s data are outdated.
To get my analyses up-to-speed with our constantly evolving GTM engine, I’ve recently been rebuilding my RevOps workflows in Omni spreadsheets. I don’t know how much “cooler” it is to say I now live in my BI tool, but I’m pretty happy about the change. Here’s why I made the switch and how my workflows changed 👇
Traditional spreadsheets can’t keep up #
Our business changes every minute, but Excel and Google Sheets require manual updates to get up to speed. This creates issues:
Data decay: Every time the sales team books a deal or a customer expands, Google Sheets doesn’t adjust until you manually redownload the data.
Version nightmares: “Wait, is this the v3_FINAL_FINAL? Or is it COPY_REALLY_FINAL_v?” Collaboration quickly becomes copy‑and‑paste chaos.
Disconnected workflows: You export accounts from Salesforce, tweak pivot tables in Sheets, then copy insights into a deck for leadership — three tools, endless context‑switching, and there’s a high chance key assumptions (like the filters you used in the data export) will go unchallenged or mistakes will be made.
From static files to live models #
As a RevOps Lead, I get all too excited when systems actually play nicely together. And our new spreadsheet feature finally gives me key functionalities I’ve wanted for years:
A familiar spreadsheet playground: It looks and feels just like Excel or Google Sheets — same formula syntax, keyboard shortcuts, and interface. I didn’t have to relearn my seasoned skills; I can dive straight in and start building dynamic analyses and models the way I’m used to.
Real‑time data: No more stale CSV exports. I can spin up queries as separate tabs, and my analyses and models pull straight from our CRM and data warehouse — live, every time I open the sheet.
Easy collaboration: Because each number ties back to a live query tab, anyone with permissions can trace the source data and applied filters, see our defined metrics, and challenge hard‑coded assumptions via comments — all in one shared, version‑controlled sheet.
What I’ve built to run RevOps #
Predictive quota attainment: A real-time forecast #
One of the most common questions I get is: Who’s on track to hit quota?
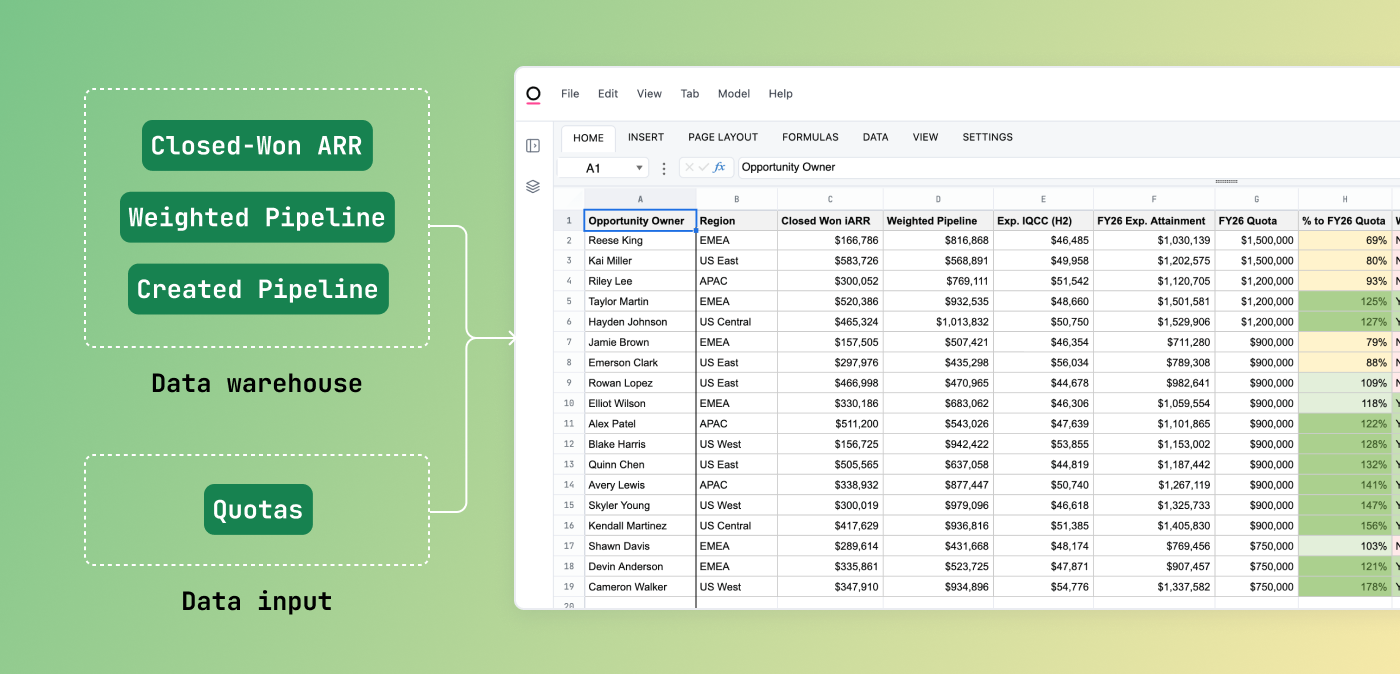
It’s a critical signal — not just of individual performance, but of how well our entire GTM engine is calibrated. In Omni, I built a live model that brings together four key inputs:
Seller quotas (quarterly or annual), uploaded once via CSV upload
Closed‑won ARR, pulled in real time from our Salesforce Opportunity Topic (a curated dataset in Omni)
Weighted pipeline, also live from our Opportunity Topic
Future pipeline assumptions, blending headcount growth drivers with historic pipeline creation
Here’s a screenshot of how that looks — on demo data, of course 😅
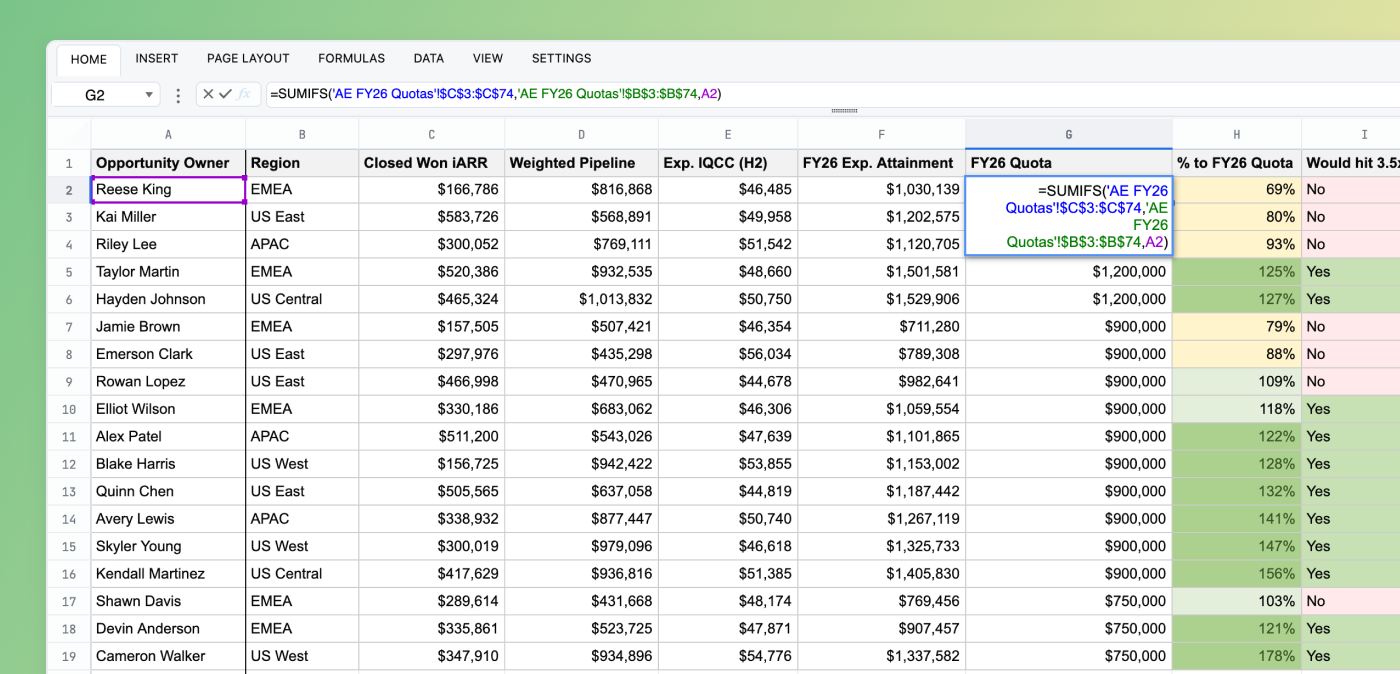
Here’s how I built out predictive quota attainment:
Import quotas: Use our data input feature to import a CSV, creating a “Quotas” tab for easy updates each quarter
Attach query tabs directly in the spreadsheet: Add three query tabs: Closed‑Won ARR, Weighted Pipeline, and Created Pipeline over a defined window.
Build predictive sheet: Use familiar formulas (INDEX‑MATCH or XLOOKUP) to join those tabs, layer in headcount/territory assumptions, and calculate each seller’s forecast vs. quota.
Voila! A self‑updating dashboard that not only tells you who’s going to hit quota, but by how much they’re poised to overachieve.
Sales Velocity: Dollars per day, live every day #
Sales Velocity gives us a real‑time snapshot of how efficiently our Go‑To‑Market engine is turning pipeline into revenue — think “dollars per day.” Its core formula is:
Sales Velocity = (Average Sale Price × # of New Opportunities × Win Rate) ÷ Average Sales Cycle
Most BI tools can’t compute this cleanly because three of those inputs (ASP, Win Rate, Sales Cycle) tie to Close Date, while # of New Opportunities must use Created Date. Mixing bottom‑of‑funnel closes with top‑of‑funnel opens skews your signal — and it requires a lot of manual work to wrestle with stale CSVs and proxy workarounds.
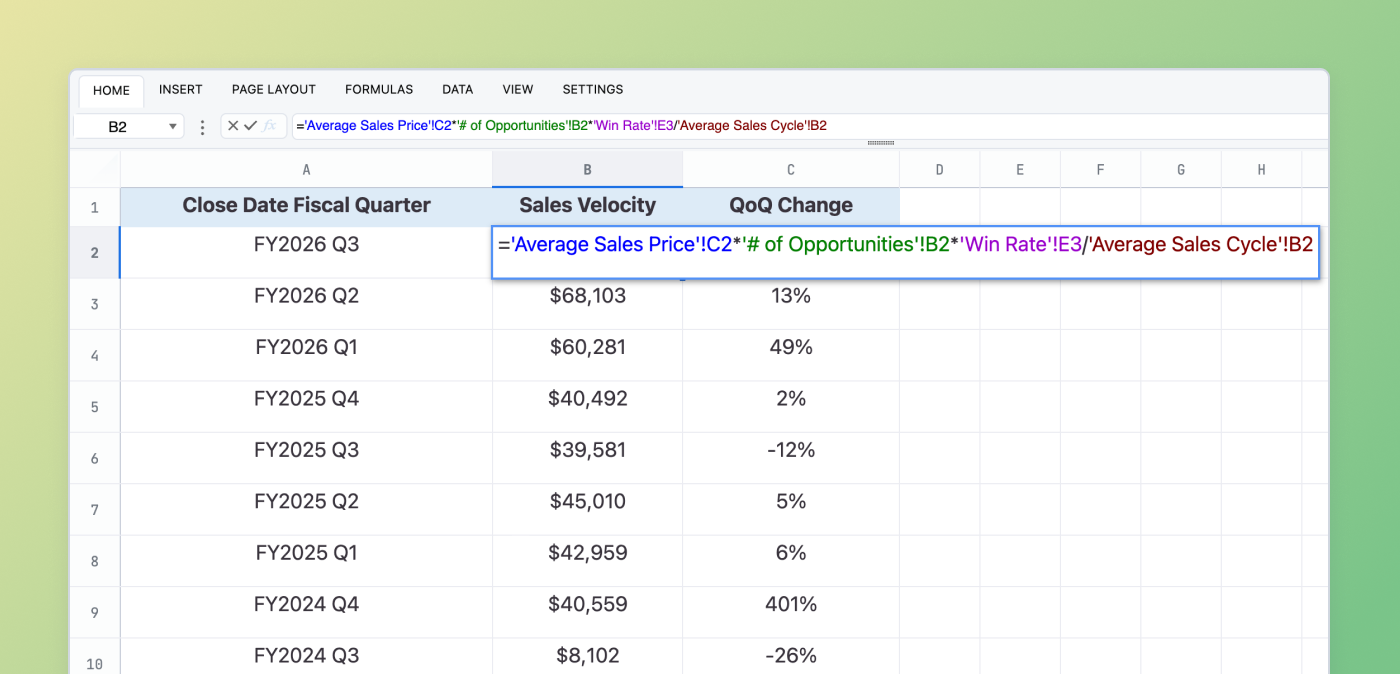
Here’s how I created this dynamic sales velocity calculation:
Spin up four live query tabs (by quarter, month, or any period):
Average Sale Price (by Close Date)
# of New Opportunities (by Created Date)
Win Rate % (by Close Date)
Average Sales Cycle (by Close Date)
Pull those tabs into one Omni spreadsheet, plug in the formula, and watch it auto‑refresh whenever our CRM or data warehouse updates.
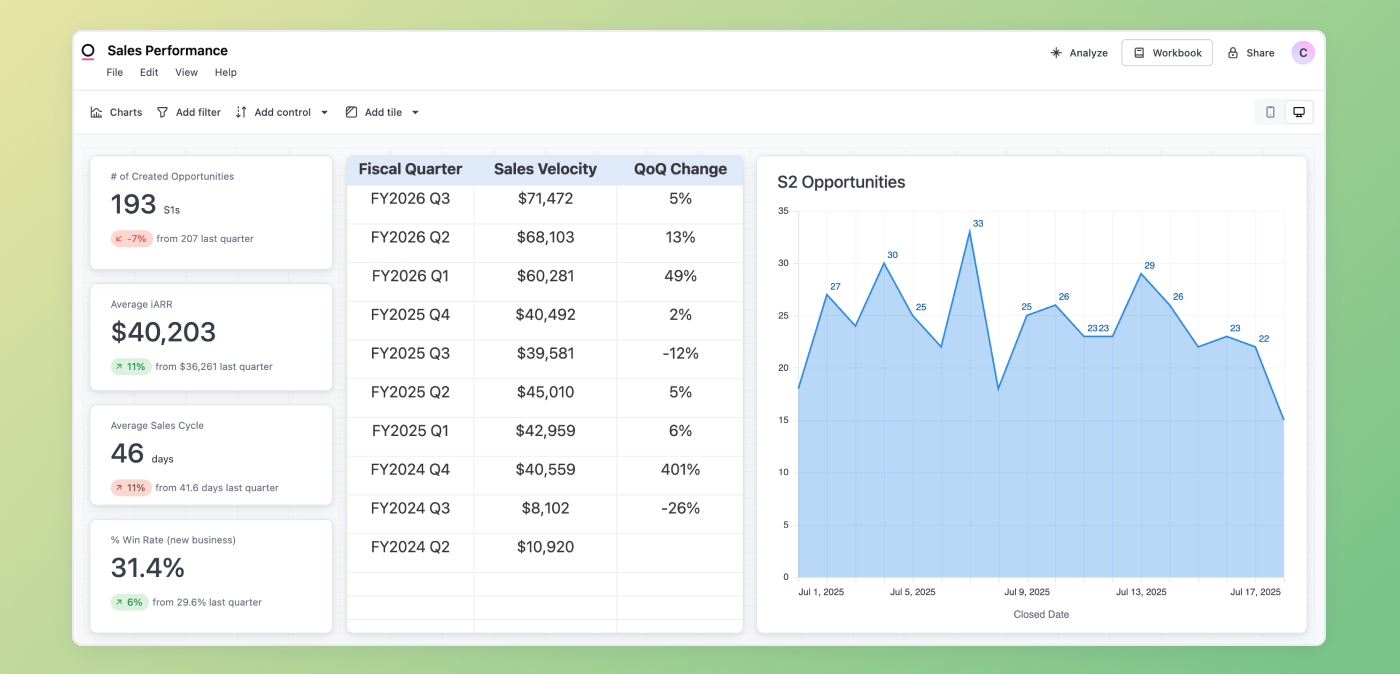
In about 15 minutes, I had a dynamic, accurate Sales Velocity dashboard which would’ve previously taken me hours to come up with a sub-par proxy.
NDR: From SUMIFS() gymnastics to simple cohorting #
Net Dollar Retention (NDR) is one of the most telling metrics for understanding how our business is growing from its existing customer base. It captures the combined impact of expansions, contractions, and churn — and is an essential lens for any revenue leader thinking long-term.
For a while, I managed all of this in Google Sheets by redownloading Salesforce Opportunity data every time I needed to run the analysis. It was tedious and required lots of tricks, like OFFSET() and SUMIFS(), to be just good enough.
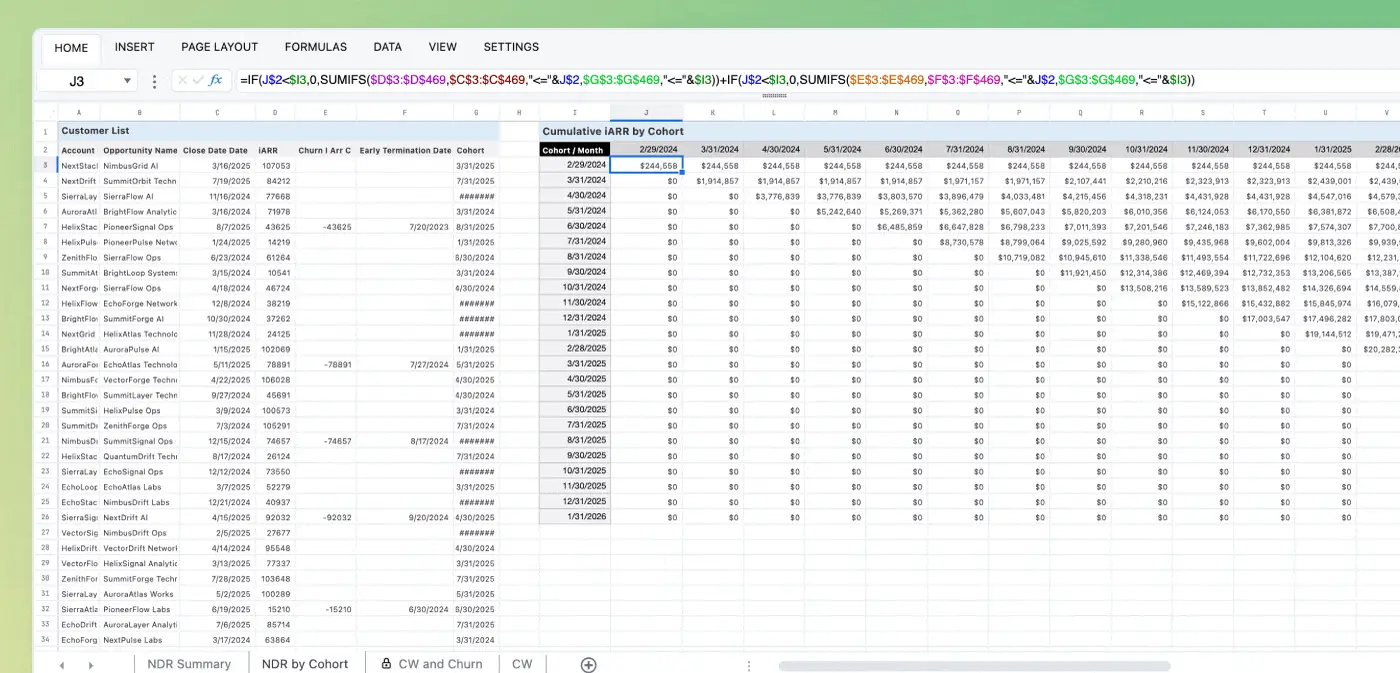
Now, my new NDR workflow is:
Query once from our Salesforce Opportunity Topic: This gives me everything I need: new business, expansions, and churn at the opportunity level on a rolling basis.
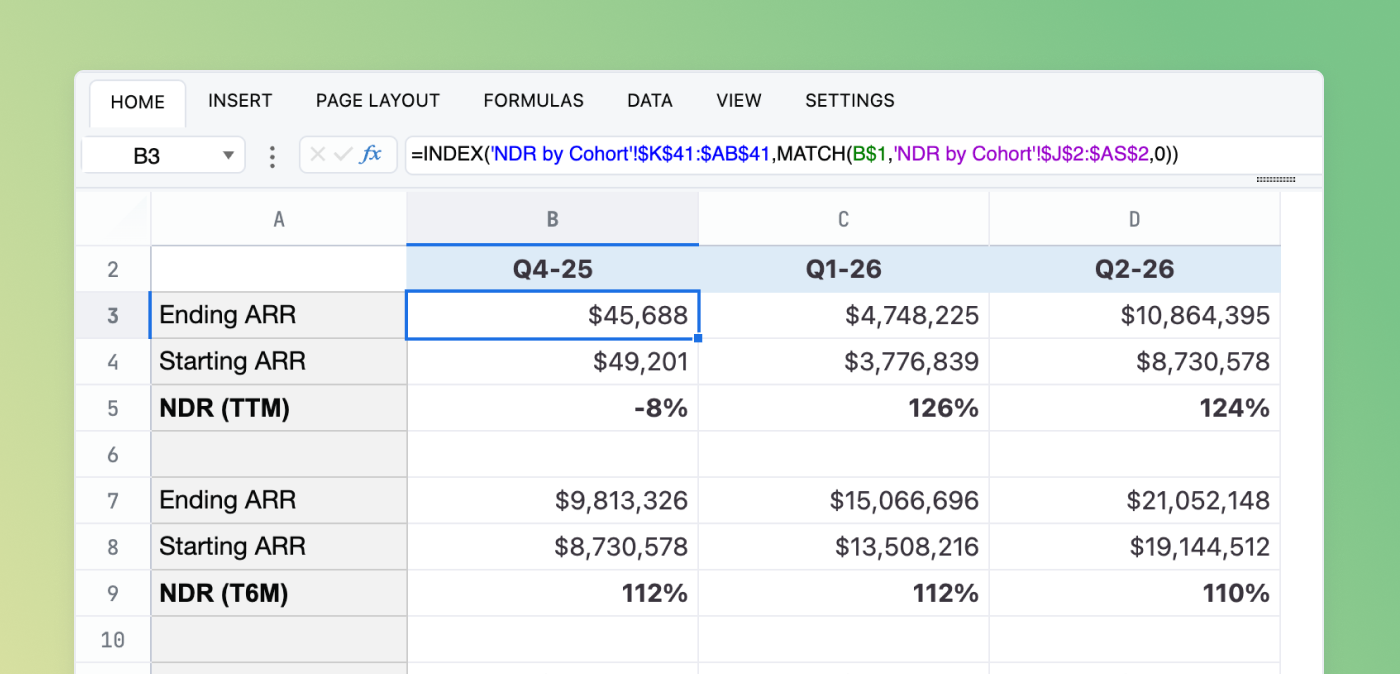
Build the spreadsheet logic:
Once that data is in Omni as a query tab in a spreadsheet, I reference the data using the UNIQUE() function and then group opportunities into monthly cohorts using formulas, like EOMONTH() and MINIFS().
From there, I calculate rolling changes in ARR by mapping account activity against both the cohort join date and the measurement period (e.g., M+3, M+6, M+12).
I then aggregate these snapshots to get cohort-level NDR trends across different time frames — all dynamically calculated.
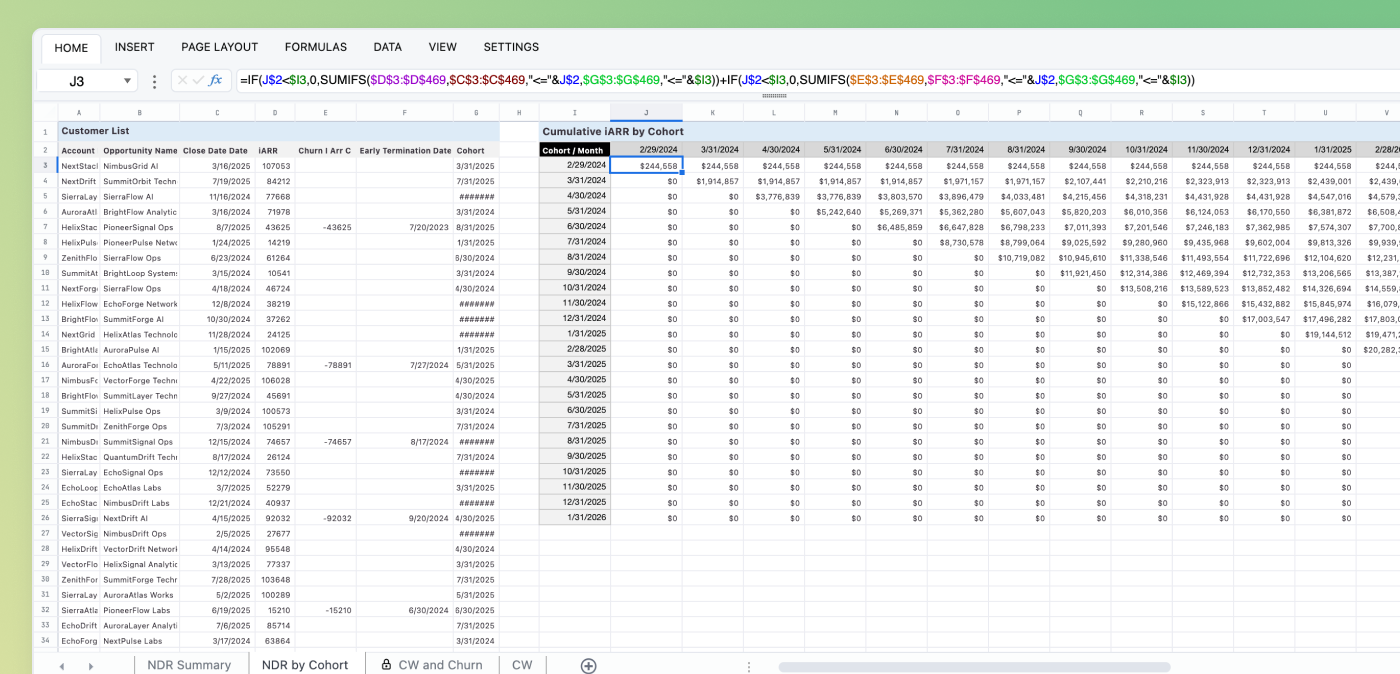
This lets me quickly assess NDR at 3-, 6-, and 12-month intervals and understand how well we’re expanding our footprint within each customer cohort over time. Our customer success team leans on this view to understand the performance of their function on a rolling basis.
✨ Bonus✨: Seamless migration from Google Sheets #
A big win for me is the seamless migration from G-Sheets to Omni spreadsheets. Once I had the Opportunity Topic hooked up, I didn’t have to rebuild my logic from scratch. I simply:
Matched tab names and column structures
Copy-pasted formulas from G-Sheets into Omni
Everything just worked — no rechecking, no formula errors, no fuss. 🙌
A big upgrade #
Since flipping on Omni’s spreadsheets, I’ve spent less time wrangling exports and more time answering the interesting questions: Where’s our fastest‑growing market? Which segment needs more inbound leads? How can Services and Partnerships lean on the same forecasts we trust in Sales? It’s still a spreadsheet at heart, but it finally behaves like the living, breathing brain of our revenue machine.
So if next time someone asks where I spend most of my work day, you’ll still hear “Salesforce.” But you’ll also find me in Omni — running live models, aligning my GTM teams, and enjoying the planning process along the way.
And if you’d like to see how we use spreadsheets in practice, you can join our CEO, Colin, on a LinkedIn Live tomorrow.