It might be difficult to imagine, but there used to be a time when companies were managed without real-time dashboards and 100-page metric decks.
Data either wasn’t available, or it was impossible to surface on time for most use cases.

“Can you quickly pull last week’s revenue breakdown before the meeting?”
Nowadays, many teams face the opposite problem: They have data on everything — but they still lack clarity. With dozens of dashboards and hundreds of metrics, it’s hard to tell what truly matters, and important insights get lost in the noise.
Teams don’t know what to optimize for, and leaders don’t know which metrics to trust.
Metrics are only valuable if they give new insights or allow people to make better decisions. As data teams, it’s our job to enable this and help the business separate signal from noise.
In this context, less is often more.
But what metrics should you be tracking at the team or leadership level? And how do you design them in a way that makes them actionable and trustworthy?
In this post, we’ll walk through how to:
Avoid the most common mistakes companies make
Select the right metrics to track — and make them actionable
Help your biz stakeholders choose the right targets for their teams
In addition, we’ll also discuss what you can do if you’re already much further along in the metrics journey and want to clean up rather than build a metrics framework from scratch.
The most common mistakes companies make in tracking metrics #
Before we talk about how to set up your metrics the right way, let’s talk about what not to do. This will help us choose a nuanced approach that avoids the biggest issues with popular metrics frameworks.
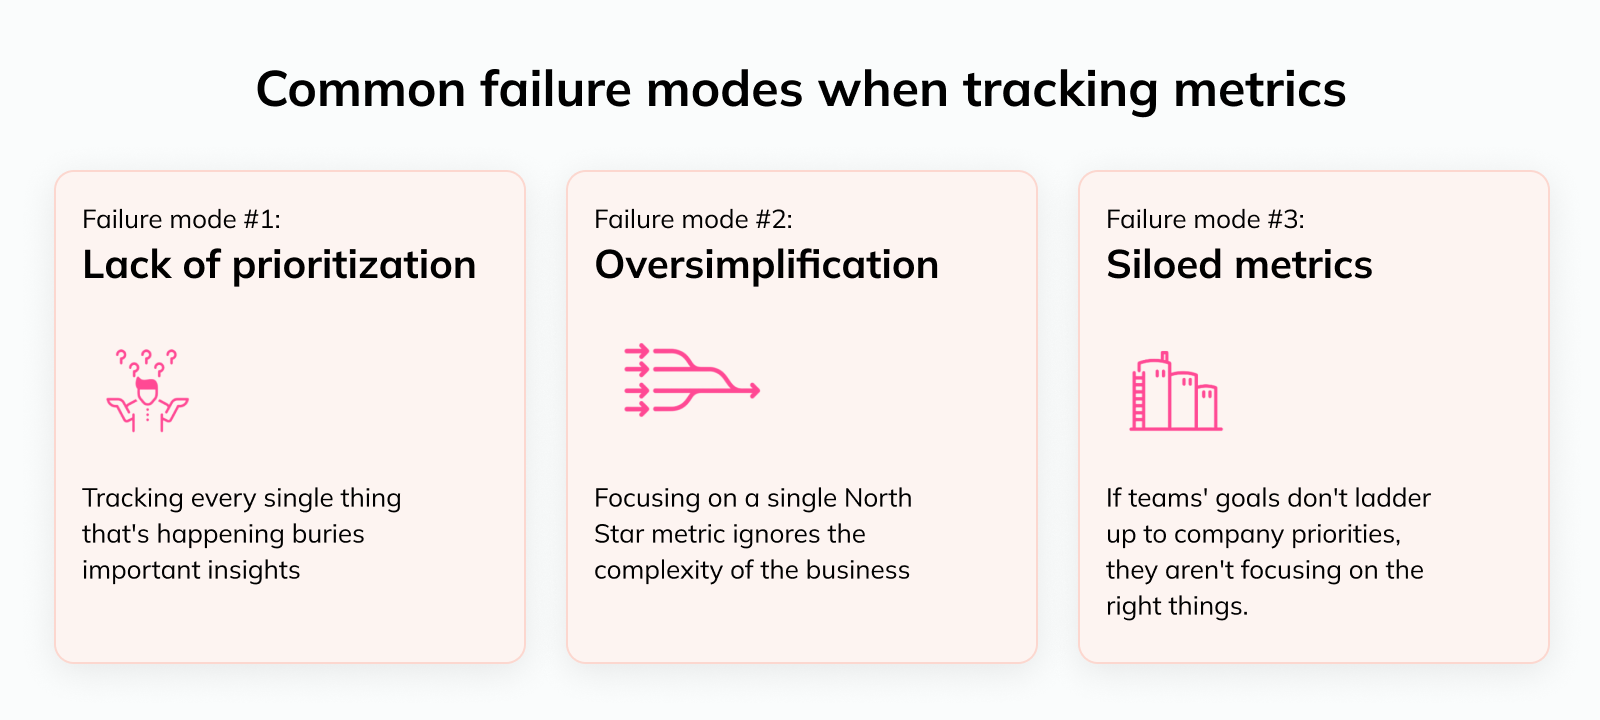
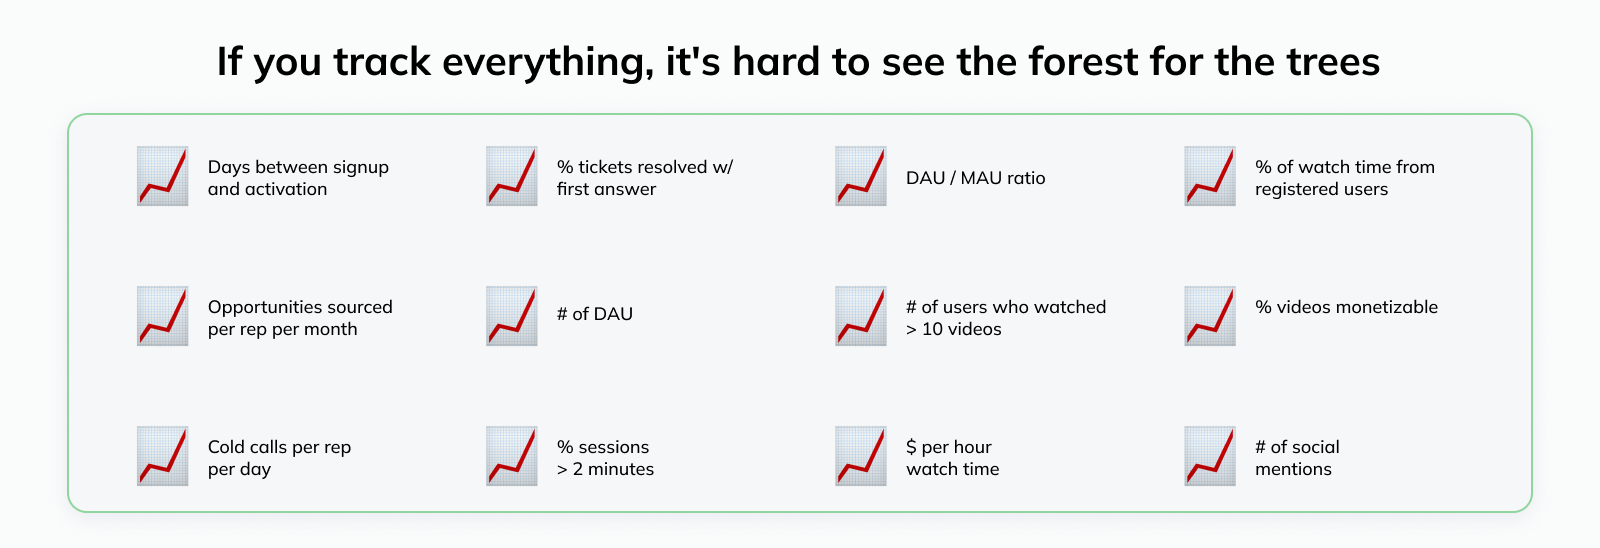
Failure mode #1: Lack of prioritization #
TL;DR: If you track everything, you focus on nothing.
Many companies and teams measure everything simply because they can. The data is available, so why not put it in a dashboard? It might come in handy at some point 🤷

This creates noise and distracts teams from their core priorities.
It’s also approaching the problem the wrong way around: You shouldn’t start by tracking everything and then try to figure out how to derive value from it. Instead, try to understand how your business works, what data business users need to get actionable insights and make decisions, and track that.
“Real estate” in dashboards is limited, and your stakeholders will only be able to stay on top of a limited number of metrics. In other words, metrics are competing for attention, and you should focus on the most relevant ones.
We'll cover how to identify these below.
Failure mode #2: Oversimplification #
TL;DR: One single metric never paints the full picture.
As a response to failure mode #1, a lot of companies drastically simplify things to focus on one single North Star metric. The North Star metric (or NSM) is, per Sean Ellis, the “single metric that best captures the core value you deliver to your customers” (we’ll talk more about this concept below).
While this can be helpful to focus teams across the company, optimizing for one single target metric while “ignoring” everything else can create massive problems.
Let’s take a music streaming platform like Spotify as an example: The NSM “Time spent listening to music” might tell us whether users are finding value in the app; but are they converting to premium users and creating value for the business as a result?
The same applies to every other company as well. Businesses are simply too complex to capture all relevant dynamics in one metric.
We’ll dig into how to address this challenge in the next section.
Failure mode #3: Siloed metrics #
TL;DR: Individuals’ and teams’ goals should ladder up to company priorities.
In many organizations, managers and teams decide what to track in a purely bottoms-up fashion. They brainstorm initiatives to prioritize, and then pick metrics to measure the impact of those initiatives.
Alternatively, the metrics aren’t directly tied to the work at all — they’re just what the team has always been monitoring.
This creates a massive problem: Even if the team hits its targets, it’s not clear whether that will help the company achieve its overall goals. And in more extreme cases, teams might even be working “against” each other, optimizing for competing priorities.

If two teams are pulling in opposite directions, the company loses.
How to select the metrics your company should be tracking #
Now, armed with an understanding of what not to do, let’s design a more thoughtful approach to metrics.
To make this tangible, we’ll walk through an in-depth example for a video platform like YouTube 👇
To start, despite the drawbacks we discussed above, we still need a clear goal to rally teams around, and the North Star metric is a helpful tool for that. We just need to make sure we embed it into a framework that addresses its shortcomings.
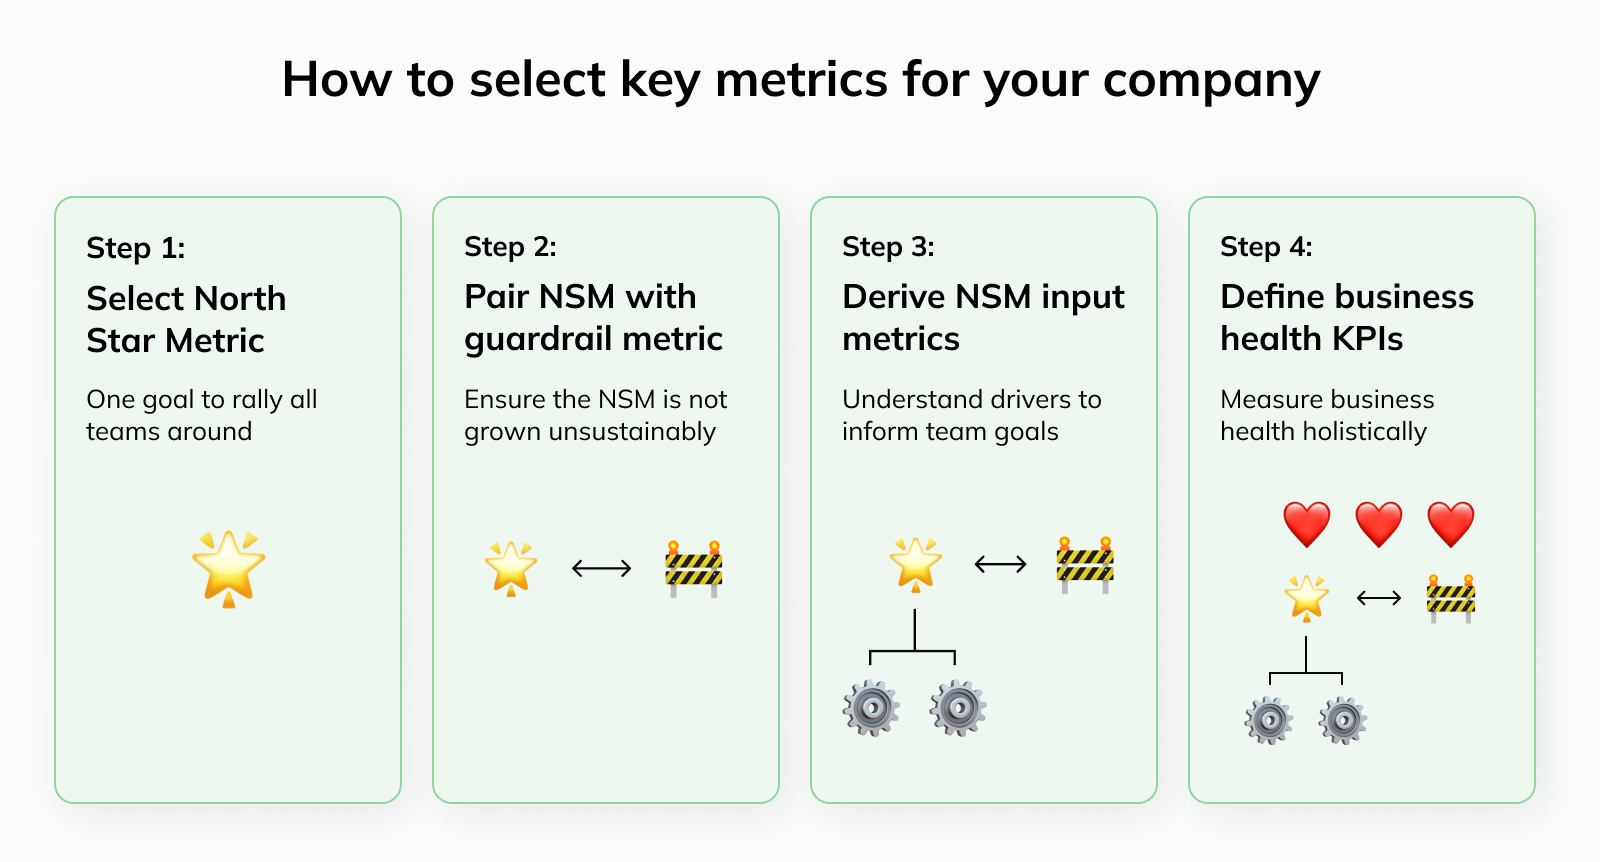
🌟 Step 1: Choosing your North Star metric #
Goal: Select one customer-centric metric to ensure all teams are focusing on a common goal.
Let’s talk about how to choose a good North Star metric. A NSM should:
Measure value created for customers
Correlate with business outcomes (e.g. revenue)
Remain constant over long periods of time (to provide stable long-term guidance for the company to organize around)
So, in the case of our streaming platform, what could a good NSM look like? To figure this out, let’s choose a few candidates and rule out the ones that don’t work:

Option 1: # of videos on site
✅️ Pros: Content is at the core of a video platform. The more videos there are, the more likely users are to find something of interest and stay engaged
❌ Cons: This metric is too far removed from the outcome we’re trying to measure. You could have a site with millions of videos but zero users
Option 2: # of video views
✅️ Pros: This addresses the shortcoming of metric #1: By measuring how often videos are being viewed, we’re tracking users’ activity levels, not just available content
❌ Cons: We’re still not truly measuring if users find the content valuable; they could click on videos based on the thumbnail and then abandon them after a few seconds. In addition, long-form content would make this number look artificially small compared to short-form videos
Option 3: Video watch time (hours)
✅️ Pros: Addresses both issues with metric #2; in addition, video watch time is correlated with revenue (the more users watch, the more ads we can insert)
❌ Cons: The connection to revenue is still indirect at best, and the metric doesn’t tell us whether users are finding long-term value (e.g. even with terrible retention, we could grow this metric by acquiring lots of new users)

While not perfect, option #3 (Video watch time) is good enough to proceed. In the next steps, we’ll build a metrics framework around it to address its remaining shortcomings.
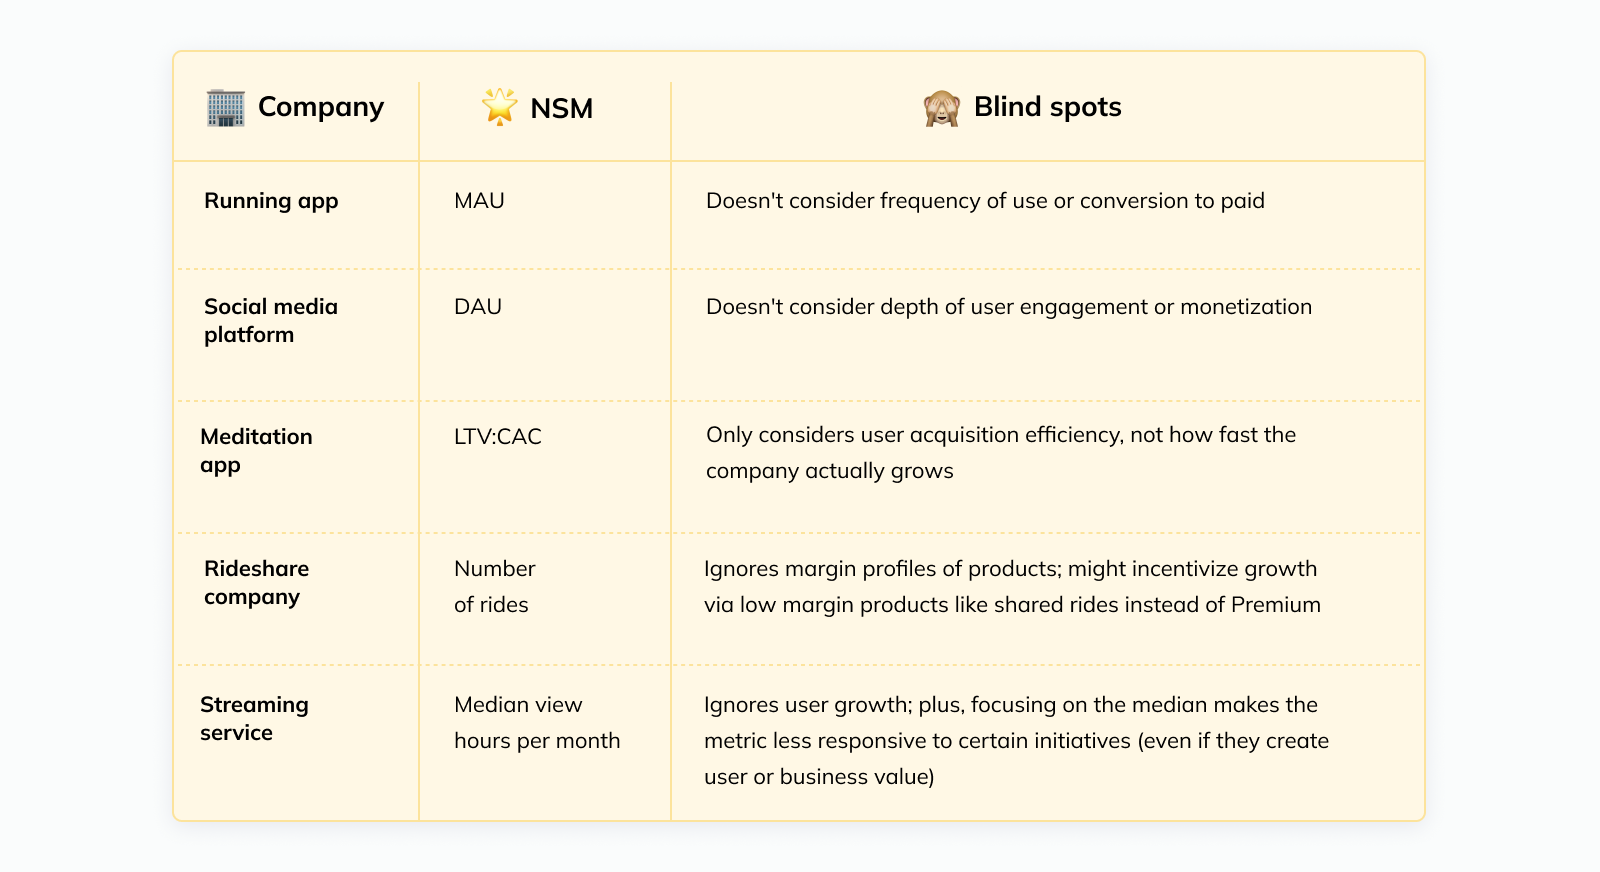
Note: No NSM is perfect. No matter what metric you choose, there will be blind spots. The most important thing is to be aware of them so you can put countermeasures in place.
Here are some examples from well-known companies 👇
🚧 Step 2: Pairing the North Star metric with a guardrail metric #
Goal: Select a metric to pair with the NSM to address the biggest blind spot.
Now, with our NSM in place, we need to ensure that we don’t optimize it in an unsustainable way (failure mode #2 discussed above). The most straightforward way to do this goes back all the way to management guru Andy Grove, who allegedly said:
“For every metric, there should be another ‘paired’ metric that addresses adverse consequences of the first metric.”
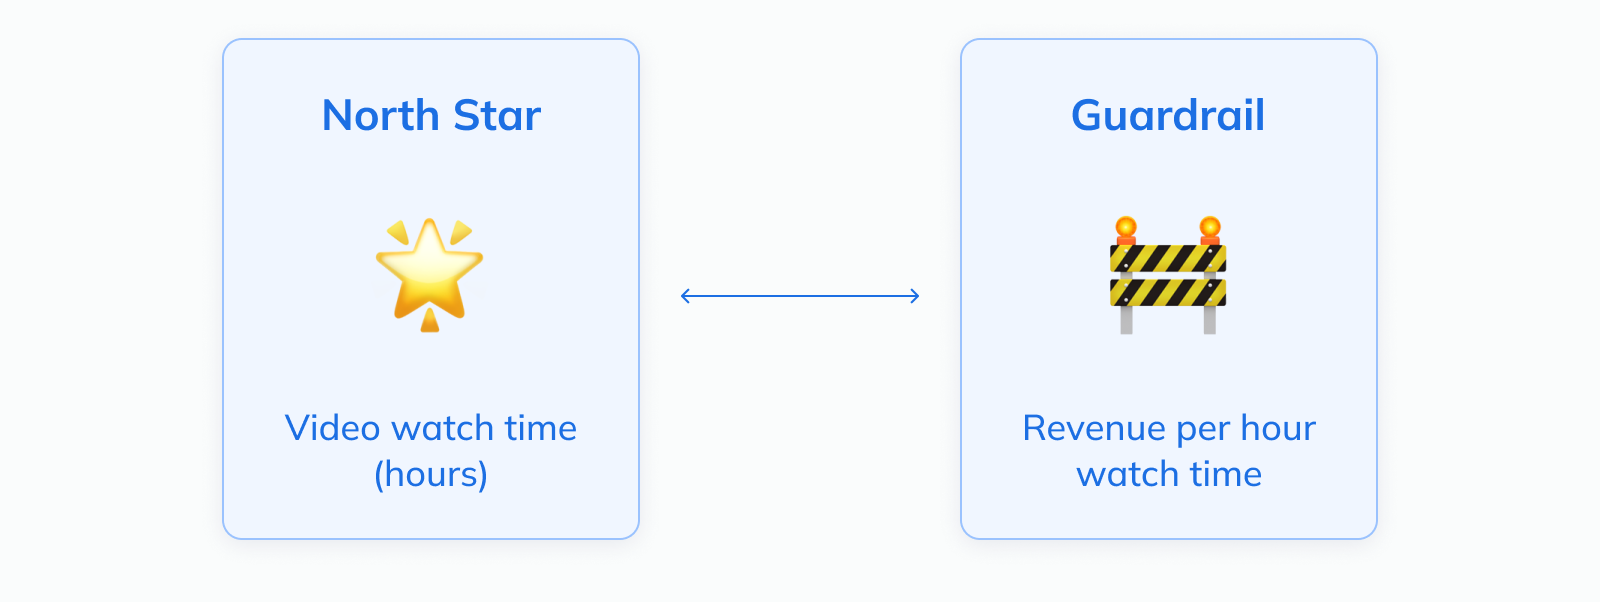
The biggest blind spot of our chosen NSM (Video watch time) is the lack of a direct link to monetization. For example, we might find ourselves in a situation where the easiest way to grow watch time is to lean into short-form video (like YouTube’s Shorts product).
However, these clips are too short for most ad types and may negatively impact monetization. Or, we might find that most of the upside for user growth is in APAC; but CPMs for ads are 10x lower there than in the US, diluting our overall monetization efficiency.
So to ensure we’re growing sustainably, we should pair our NSM with a monetization metric like “Revenue per hour watch time”:
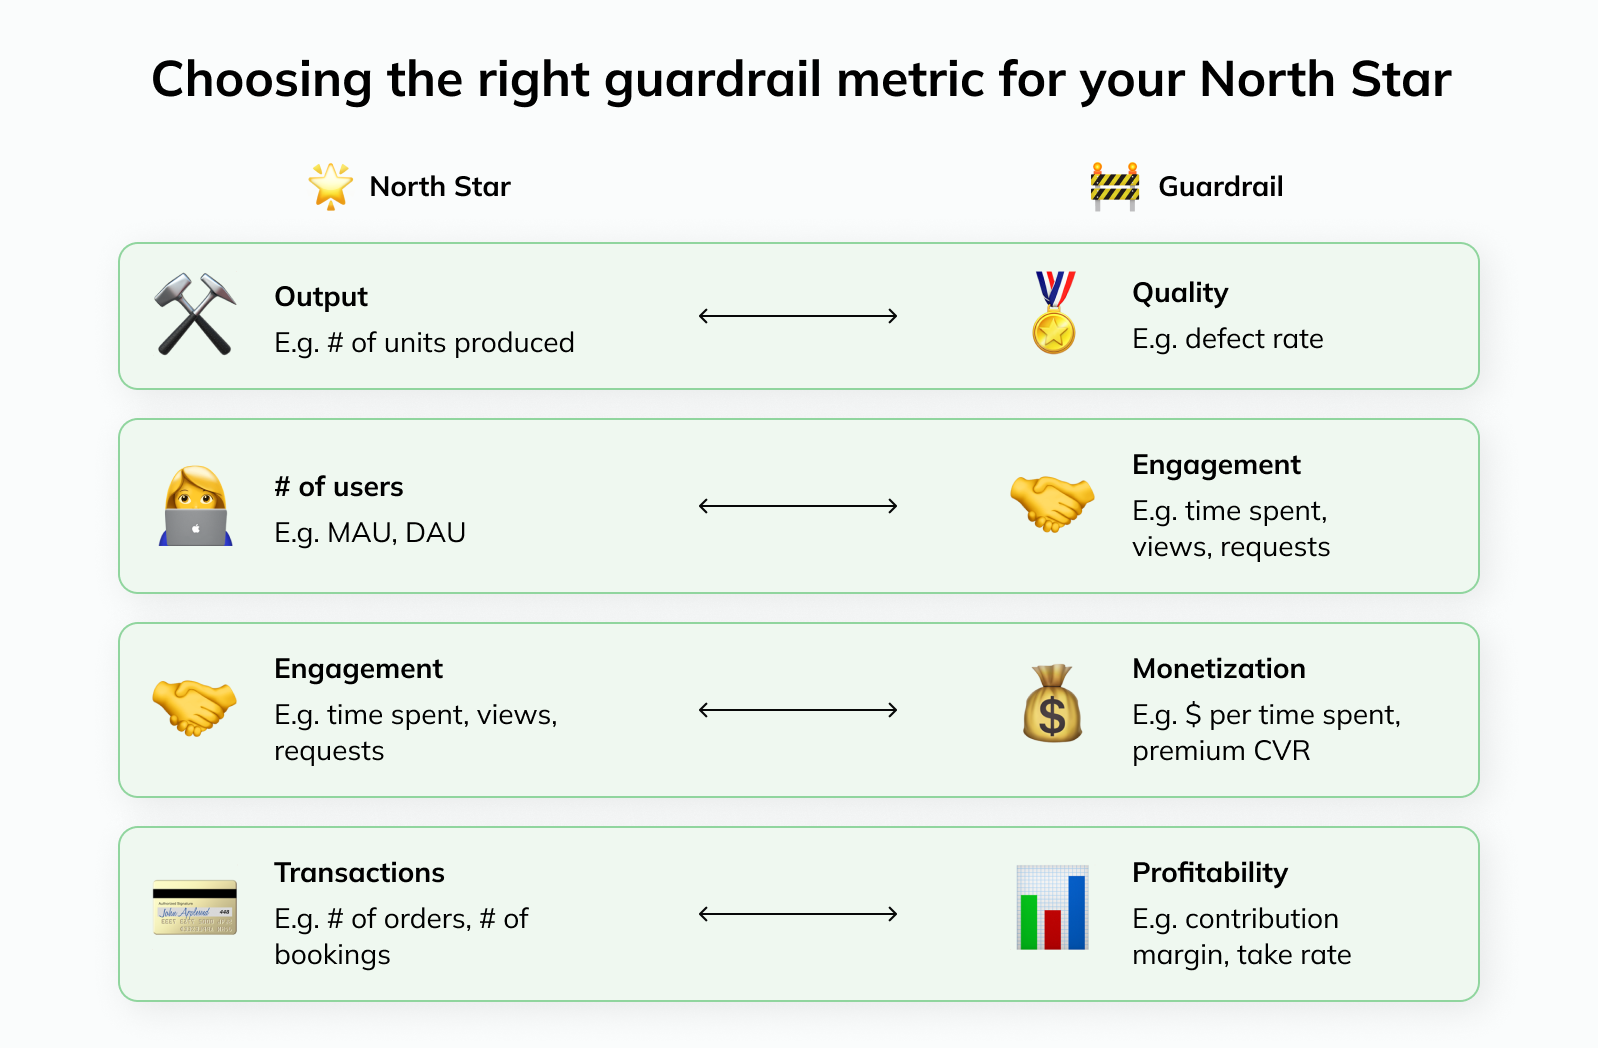
At this point, even if the example makes sense to you, you might wonder: How do you generalize this and apply it to your own company?
To help you with this and pick the right guardrail metric for your NSM, we’ve compiled a few common combinations:
⚙️ Step 3: Derive input metrics #
Goal: Understand the drivers of the NSM to inform team goals.
The North Star metric represents an output. This is important as it tells us whether what we did had the desired impact. However, it doesn’t tell us what we need to do.
As a result, the NSM itself isn’t a particularly helpful goal for teams. Similar to the north star in the sky, it provides a high-level direction for teams; but in order for it to be actionable, we need to create a more detailed “map” teams can navigate — in other words, an overview of the levers each team can pull to improve it.
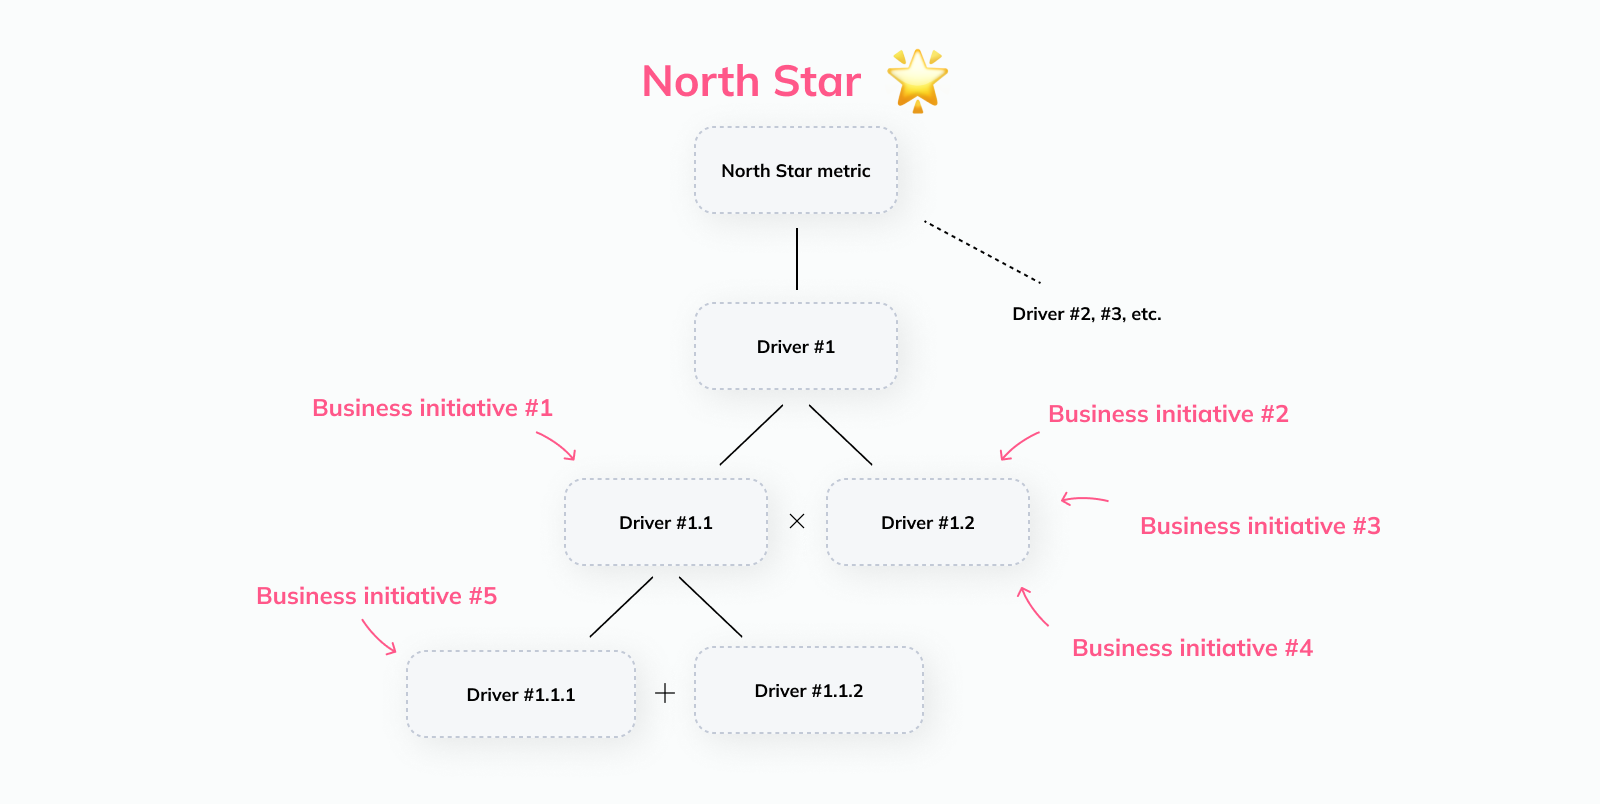
This means we need to decompose the NSM into its drivers:
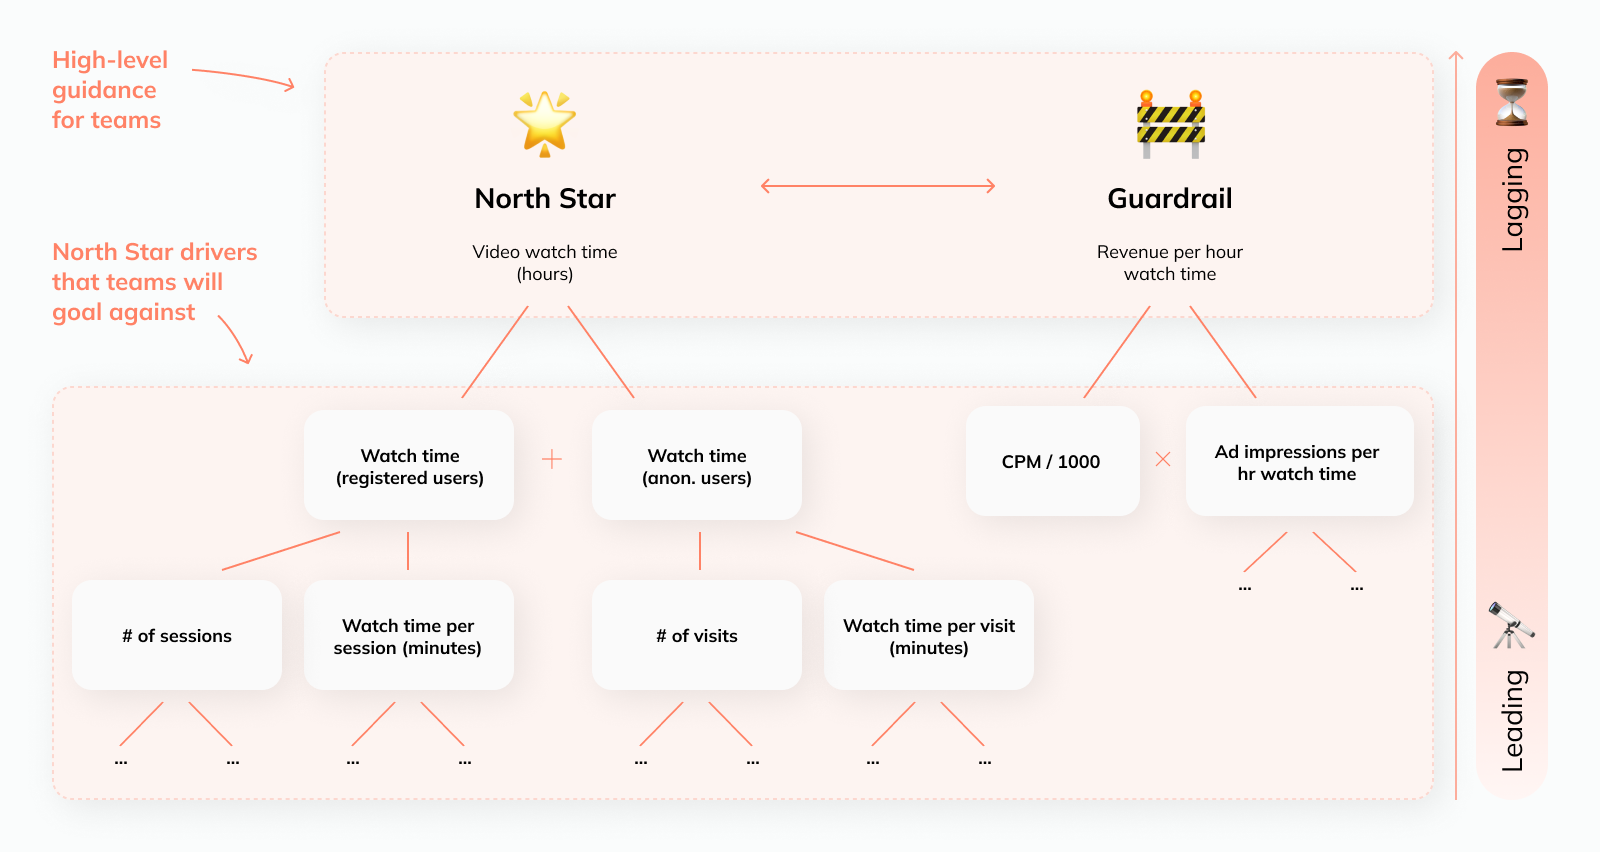
As a general rule: The higher you are in your driver tree (i.e. closer to the NSM), the more likely it is that a metric is affected by multiple teams. The lower you go (i.e. further away from the NSM), the more likely it is that an individual team — or even person — is responsible for driving it.
For example, the metric “# sessions” is influenced by many different things. But if you continue decomposing it even further, you’ll eventually reach metrics such as the number of sessions generated from certain levers like push notifications, which will likely have a clear owner.
Note: The quantitative decomposition of the NSM is just one dimension. In addition, you should outline what product features or work streams affect a certain metric.
The relationship will not always be strictly mathematical, but it can help you (and your business stakeholders) understand what additional inputs should be measured:
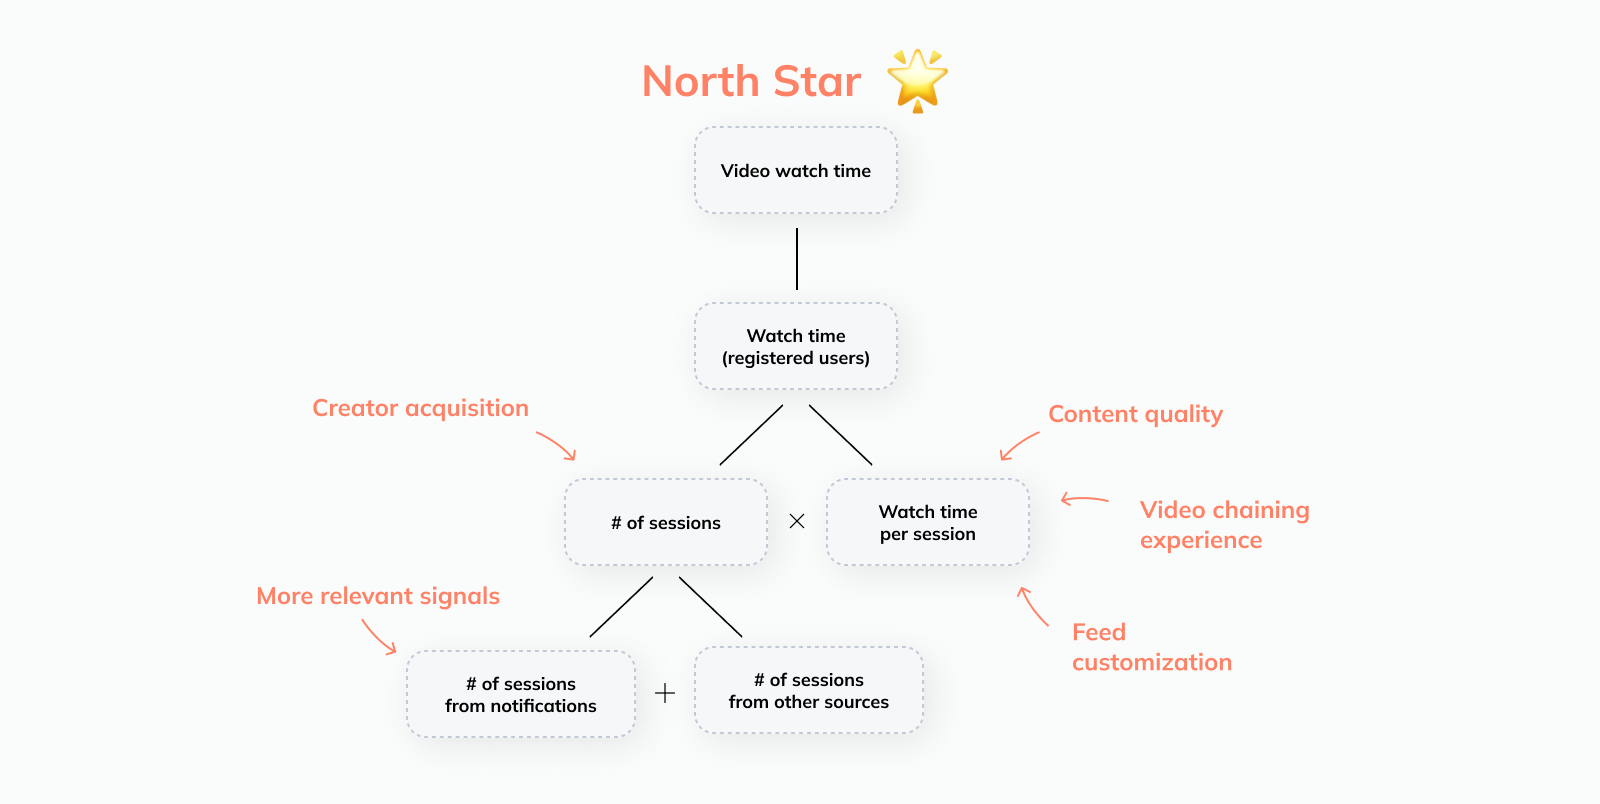
For example, while the driver tree tells you that things like notifications are important for driving incremental sessions, there are other important opportunities that you might miss if you don’t take a more holistic view (e.g. bringing popular creators onto the platform and improving content variety are key to growing sessions in the long term).
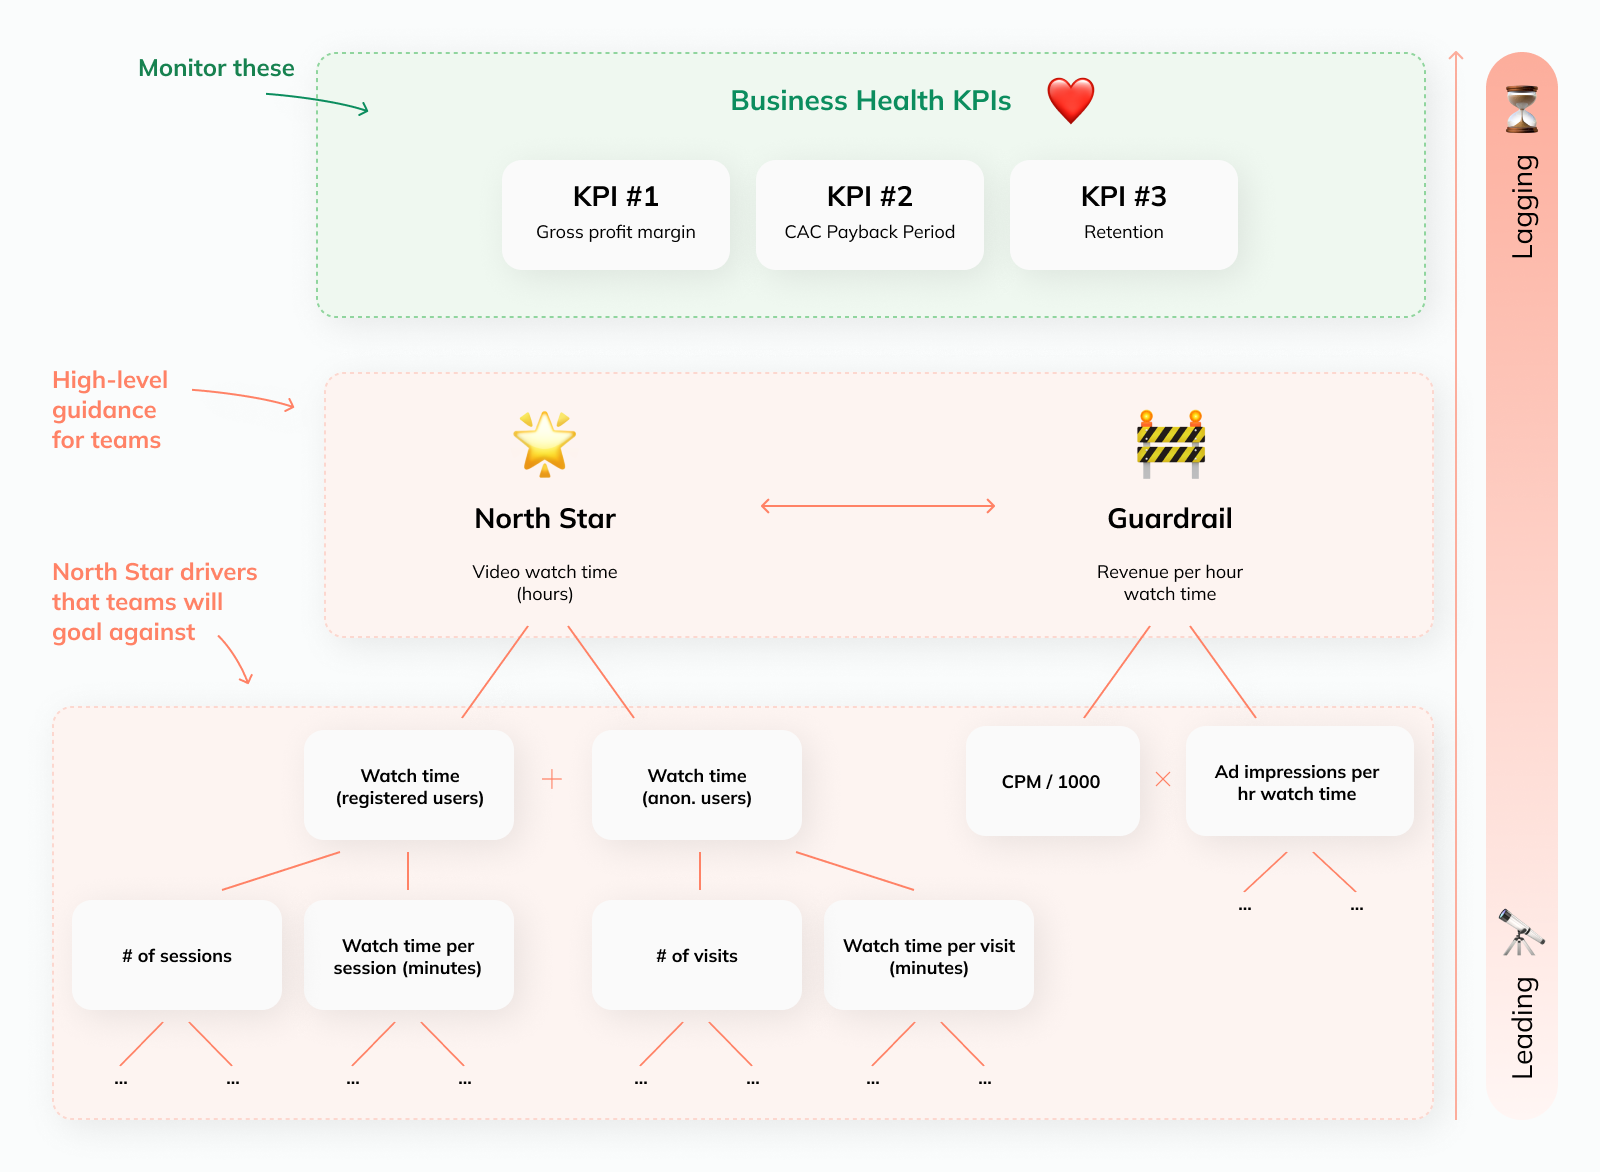
❤️ Step 4: Defining business health KPIs #
Goal: Select a few topline KPIs that measure business health holistically.
Even with the NSM, its drivers, and the guardrail, we still don’t have a comprehensive view of how our business is doing.
As a result, you’ll want to define a handful of additional KPIs that tell you how efficiently your business is operating, whether users are sticking around, etc. In the case of our video platform, these metrics could plug that gap:
Gross profit margin: In order to attract high-quality content to the platform, we need to share revenue with creators. Monitoring gross profit margins ensures we strike a healthy balance between investing in our content ecosystem and operating profitably
CAC payback period: A user acquisition efficiency metric like our CAC payback period (“How long does it take us to earn back the customer acquisition cost?”) will tell us whether our acquisition strategies are sustainable
Retention: We can’t run a sustainable business if all our engagement growth comes from costly initiatives to acquire new users instead of retaining existing ones. Cohort-based retention curves will tell us whether we’re doing a good job creating continued value for users
To be clear: We still want every initiative in the company to be aimed at improving the North Star metric — that’s the whole point of having one in the first place.
The additional metrics (the guardrail metric and the business health KPIs) are there to ensure we don’t have tunnel vision and are growing the business in a sustainable, profitable way.
How to help your business stakeholders select the right metrics for their teams #
Laying out the relevant metrics is the first step; next, as a thought partner to your business stakeholders, you need to help them figure out which metrics should be used as targets for their teams.
This is an iterative process: As you’re working with your stakeholders to select the right metrics, you might notice that there are challenges with the set-up of your driver tree or the metric definitions you chose, and you might have to go back and revise them.
In the next sections, we’re laying out a few guiding principles to help you with this:
Connecting metrics to the North Star #
Team-level target metrics should ladder up to the NSM; this ensures that everyone is working towards a shared goal.
As discussed before, that link doesn’t always have to be so direct that you can quantify exactly how an improvement in your metric will improve the NSM. But at the very least, there should be a clear logical connection.
For example, in the case of an engineering team working on an internal tool that recommends user signals for push notifications to the Growth team, you could set a target with regards to the number of signals surfaced. While not a direct part of the NSM driver tree, there is a concrete logical link:
More signals surfaced → more relevant push notifications → more sessions
If that’s not possible because a team is too far removed from these metrics, it can be a good option for this team to share the target metric of a downstream internal customer.
For example, a BizOps team helping Marketing to leverage AI to speed up the creation of new ad campaigns could take on a shared goal regarding the number of campaigns launched or signups generated.
It can also be a good idea to combine options 1 and 2; we’ll dive deeper into this in the next section below.
Combining inputs and outputs #
Similar to how we set a guardrail metric for our NSM to get a more holistic picture and avoid potential adverse consequences, it’s often a good idea to goal teams on both the inputs and outputs of their work.
Output metrics help ensure that the team’s work drives business impact
🚨 However, outputs can be affected by factors outside an individual team’s control and usually take a while to react to new initiatives
Input metrics are more responsive and under the immediate control of the team. Setting targets on these ensures teams feel empowered and have a proxy to monitor whether they’re on the right track.
🚨 However, this can lead to teams overoptimizing for work that appears productive but doesn’t actually move the needle for the business
Setting a goal for both ensures we drive the outcomes we actually care about while giving the teams a sense of control and a leading indicator.
For example, in the case of our video platform, the Creator Partnerships team focuses on convincing creators to move their content and audiences to us.
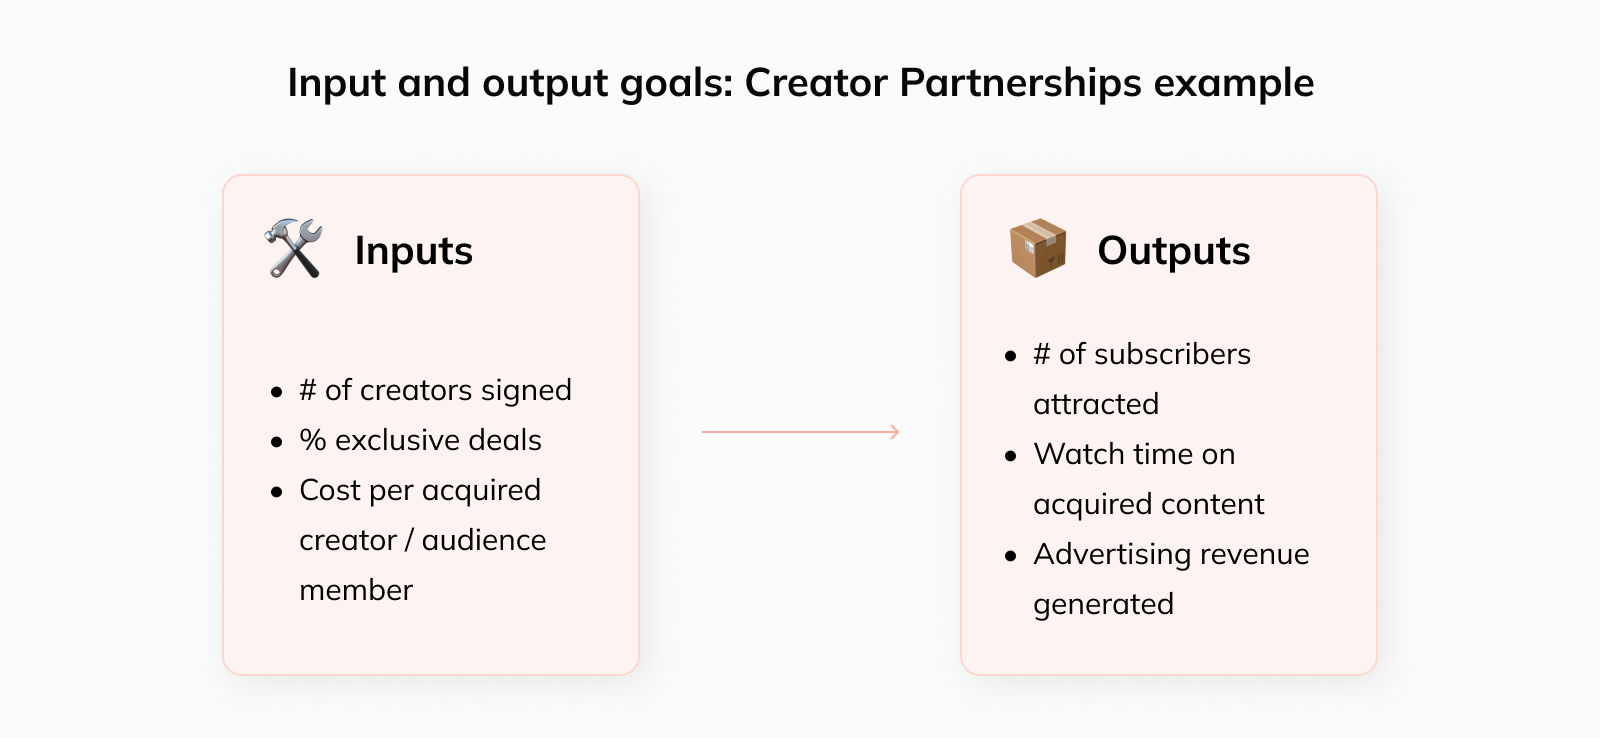
The inputs we could measure them on include:
How many creator deals they sign (potentially weighted by the size of their audience)
How many of those deals include exclusivity clauses (so we get unique content)
And so on.
However, ultimately we care that this work moves the needle on business goals. So in addition, we should set target metrics that measure outputs; for example:
How many subscribers (new and existing) these creators attract on our platform, or
How much watch time or advertising revenue the creators’ content generates
Considering cross-team interactions #
Another key consideration is that target metrics for teams should not be chosen in isolation; otherwise, you risk friction and confusion.
There are two “flavors” of this:
Teams accidentally work “against” each other simply by trying to hit their respective goals
One team’s target is a direct input to another team’s goal, making it difficult to assess performance
Cross-team interaction #1: Teams accidentally work against each other
Let’s go back to our example from the beginning. We set the guardrail metric for the NSM (“Revenue per hour watch time”) to avoid scenarios where watch time is grown at the expense of monetization efficiency.
The challenge is that in practice, these metrics would likely be owned by different teams: One team focuses on driving more sessions and watch time, another handles the ads. In addition to having the right metrics in place on the company level, we need to make sure they are operationalized effectively on the team level.
Here are two options to address this:
Give the first team a “budget” with regards to how much their efforts can impact monetization (and track the actual impact via a holdout group).
Pick target metrics that inherently account for this tension. For example, the engagement-focused team could take on goals by region so that they’re incentivized to grow more mature — but profitable — markets like the US as well instead of focusing purely on the regions with the largest upside for user growth.
Cross-team interaction #2: One team’s target is a direct input to another team’s goal
Imagine you have two teams in your company working on related areas:
The first team is working on initiatives to get users to come to the platform more often and is goaled on the “number of sessions”
The second team is trying to grow the time users spend watching videos and is goaled on “total watch time”
Now, let’s say Team #2 ends the quarter with a 12% increase in “total watch time”, compared to their goal of 10%. They knocked it out of the park, right?
Unfortunately, things are not that simple. The metric “Total watch time” is driven by 1) the number of sessions and 2) the time users spend per session.
In other words, the work of Team #1 heavily affects the target of Team #2, and it’s even possible that they only hit their goal because of this (while their own initiatives didn’t drive any watch time increases at all).
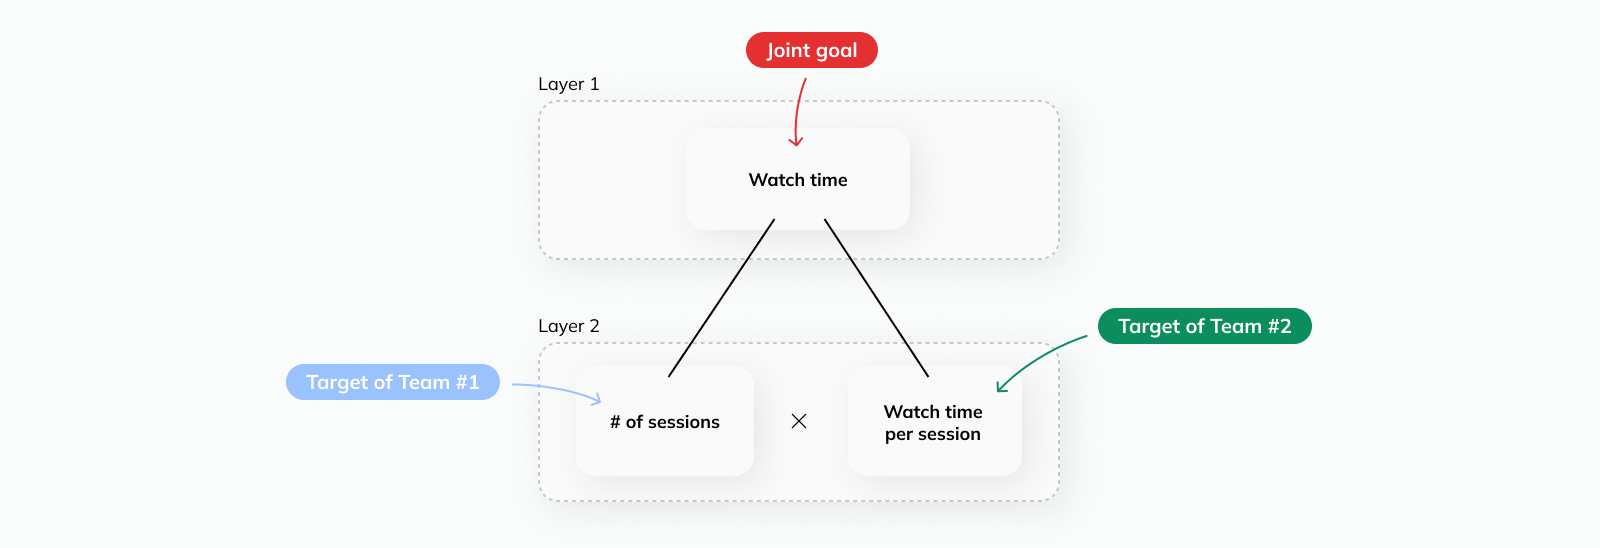
A general rule that can help you avoid this: Whenever possible, different teams that work towards a common goal should have target metrics on the same level of the driver tree instead of being upstream or downstream from each other.
So in this case, Team #2 should have been goaled on “Watch time per session”; that way, any growth in total watch time can be attributed to a specific team’s work.
Keeping metrics simple and transparent #
No matter which metrics you choose: They need to be easy to calculate and understand, or you’re bound to run into issues sooner or later.
If teams don’t understand how a metric is calculated, they won’t be able to manage it well.
How do you respond to metric movements if you’re not sure what might have caused them?
How can you plan impactful initiatives that improve your target metric if you don’t understand the math behind it?

This happens a lot with complex compound metrics like LTV : CAC (where the numerator and denominator both consist of other metrics with their own opaque definitions) or internally-developed metrics that nobody understands besides the analyst who invented them.
In addition, metrics often become more complex over time as teams try to address perceived shortcomings of the initial definition.
For example, if you try to calculate win rates for B2B deals or retention rates for users, you’ll have to wait a long time until your cohorts have fully matured. But if you build a forecast of cohort performance into the metrics instead, wouldn’t you be able to get answers immediately?
Unfortunately, in practice, this often causes more issues than it solves. Simplicity beats (false) accuracy almost every time.
Data teams don’t show their value by acting as gatekeepers for complicated, opaque metrics — they do it by making it as easy as possible for the business to extract insights from data.
Taking a step back: How do you clean up your metrics if you’re already far along in the journey? #
As you’re reading this post, you might be thinking:
“This all sounds great in theory if you’re a startup in the process of building out a metrics foundation. But what if you are tracking a huge number of metrics already and want to clean up and reprioritize?”
That’s a fair point — the tips above are easiest to implement if you don’t have a messy status quo to wrangle with. So what can you do in that case?
Under these circumstances, the goal should be to identify the set of metrics that truly matter. Not all metrics that you’re tracking will be direct inputs to decision-making or even be regularly reviewed. In other words: You need to separate signal from noise.
If your company has an official North Star, you can work backwards from there and, similar to what we covered above, see which metrics are direct inputs to it.
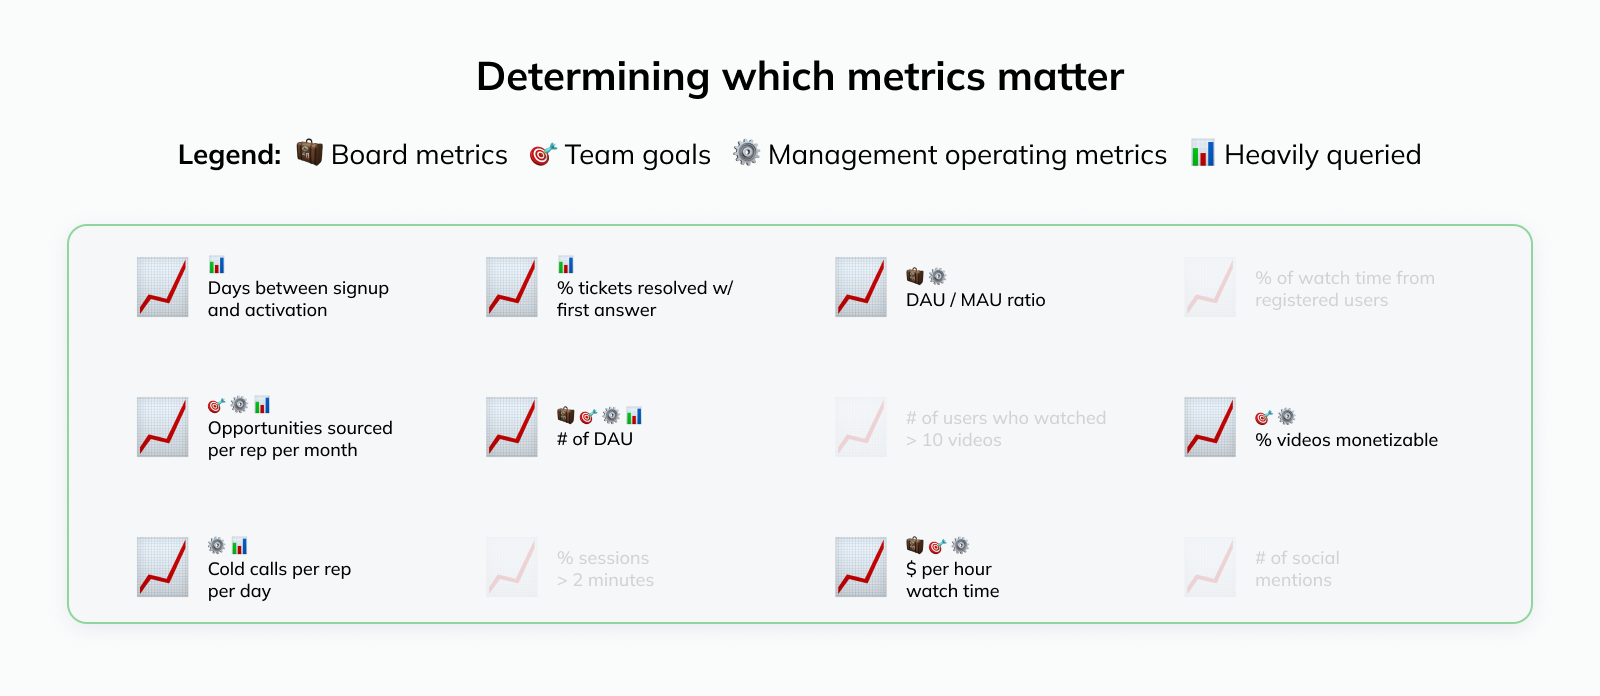
In the absence of a North Star, I recommend starting with the metrics that are tied to official commitments:
💼 Board metrics: What metrics are reported to the Board of Directors and investors? What are their direct inputs and drivers?
🎯 Team goals: What metrics are teams goaled on? Which metrics tie directly to performance ratings or monetary incentives of individuals (e.g. quota-carrying sales reps, customer success managers, support reps etc.)?
These metrics are more difficult to change in the short term, so they represent the “core” of your set of metrics for the time being. In addition, you’ll want to understand the operational side of things:
📊 Data usage: Who are the main data consumers across the company? Which dashboards and metrics are they accessing the most?
⚙️ Management: What metrics are team leads looking at to make decisions and run their part of the business? What is their mental model of how these metrics connect to company goals?
This gives you a good initial understanding of which metrics are likely essential, and which ones might be expendable:
The eventual goal should be to integrate the metrics into a holistic framework like we covered earlier. But that’s a lofty goal; to make it more manageable, here are some concrete things you can do to start moving in that direction:
North Star: Even if your company doesn’t have an official North Star, it might be clear from your assessment and conversations above that there is an implicit one. Creating visibility around this shared goal is a good next step
Team goals: Are there any improvements to goal metrics you can propose during the next planning cycle based on the best practices discussed above?
Phase out less essential metrics: The best way to see if something adds value is to see if people miss it when it’s gone. For this reason, Shopify deletes all recurring group meetings once a year. You don’t have to go quite that far; however, I’ve found it helpful to move metrics that you suspect are less essential out of the main tabs of dashboards or into the appendix of slide decks (and let your stakeholders know). More often than not, nobody will complain
Plugging gaps: Even if you’re trying to reduce the number of metrics you’re tracking: If there are obvious gaps (e.g. no guardrail for the North Star), it’s important to propose a metric to plug them. The goal isn’t to have fewer metrics per se; it’s to remove those that distract from the essential ones
Recap: Creating a holistic metrics framework for your organization #
Phew, that was a lot 😮💨.
Building something that doesn’t just sound nice but actually works in practice requires a deep understanding of how the business operates and… lots of hard work.
But developing an intentional, holistic approach to metrics is worth it. It’s the foundation for everything:
How your stakeholders look at the business, and the decisions they make
Whether teams are working towards company priorities or are incentivized to do other things
Whether dashboards, models, and experiments create clarity or just add more noise
Hopefully, the framework in this article gives you a helpful starting point.
Want more frameworks & news from our team? Subscribe to our newsletter to become omniscient 😉