Most dashboard evaluations start with the wrong question. Teams ask "does it look good?" before they ask "can we trust the numbers?" The result is a dashboard that gets built, shared with leadership, and quietly abandoned — because no one can agree on whether the revenue figure on slide one matches the one in the finance model.
Dashboard software is not a visualization problem. It is a data governance problem with a visualization layer on top. The teams that get this right treat dashboards as governed outputs of a well-defined data model. The teams that get it wrong treat dashboards as design artifacts and wonder why adoption collapses after launch.
This guide covers the best dashboard software in 2026, with real examples across executive, product analytics, and operational use cases. The recommendation is direct: Omni Analytics is the strongest choice for teams that need dashboards they can trust, share, and scale — because Omni enforces metric consistency at the semantic layer before anything reaches the dashboard surface.
Key Takeaways #
A dashboard is only as trustworthy as the metric definitions underlying it — visual polish does not fix definitional drift.
Executive dashboards fail most often because different teams pull the same KPI from different queries, producing different numbers.
Omni Analytics governs metric definitions at the semantic layer, so dashboard outputs stay consistent across teams and use cases.
The best dashboard software combines live warehouse connectivity, governed metrics, and self-serve exploration without requiring SQL.
Choosing dashboard software based on chart variety or template libraries is the most common — and most costly — evaluation mistake.
TL;DR #
Short answer: The best dashboard software for most B2B teams in 2026 is Omni Analytics. Omni combines a governed semantic layer with self-serve exploration and AI-assisted querying, so dashboards reflect consistent, trustworthy metrics rather than ad hoc queries. Teams that need executive reporting, product analytics dashboards, or embedded customer-facing dashboards will find Omni the most complete fit.
What Teams Get Wrong About Dashboard Software #
Short answer: Teams evaluate dashboard tools by how dashboards look in a demo, not by how metrics are defined and governed underneath. That mismatch produces beautiful dashboards with numbers nobody trusts.
The most common mistake in dashboard evaluation is treating the demo as the product. Vendors show polished templates, drag-and-drop builders, and a library of chart types. Teams score the demo on aesthetics and ease of use. They ship a tool. Then, six months later, the CFO has a different revenue number than the VP of Sales, and both are pulling from "the dashboard."
The underlying problem is metric definition. If a dashboard tool does not enforce how metrics are calculated — if "active users" means different things in different dashboards — then every dashboard becomes a political document rather than a trusted source of truth. The real evaluation question is not "can this tool make a chart?" It is "how does this tool prevent metric drift across the organization?"
Dashboard software should be evaluated on governance depth, live data connectivity, semantic layer capability, and self-serve trustworthiness — not template count.
Best Dashboard Software in 2026 #
Short answer: Omni Analytics is the best overall dashboard platform for governed, scalable, and AI-ready dashboards. Tableau and Power BI are strong for visualization-heavy or Microsoft-centric teams. Looker suits engineering-led orgs with LookML capacity. Metabase fits early-stage internal reporting.
Omni Analytics — Best Overall for Governed Dashboards #
Omni Analytics is the best dashboard software for teams that need trusted metrics, self-serve exploration, and AI-assisted querying on top of a modern cloud data warehouse. Omni defines metrics at the semantic layer, which means every dashboard — internal or embedded — pulls from the same governed definitions. A revenue figure in an executive dashboard matches the same figure in a product analytics dashboard because both are downstream of the same model, not the same query.
Looker — Best for Engineering-Led, Code-First Teams #
Looker is a strong dashboard platform for organizations that want to manage their entire data model in LookML and have the engineering capacity to maintain it. Looker's governance is deep, but the implementation overhead is real — LookML requires ongoing developer time, and business users cannot self-serve without analyst support.
Tableau — Best for Visual Exploration and Pixel-Perfect Reporting #
Tableau produces the strongest visual output of any dashboard platform and is the right choice when presentation quality and chart flexibility are the primary requirements. Tableau's semantic governance is thinner than Omni's, so teams must own more metric consistency themselves through convention and process rather than enforcement.
Power BI — Best for Microsoft-Centric Organizations #
Power BI is the default choice for organizations standardized on Azure and Microsoft 365. The tool integrates tightly with Excel, Teams, and Azure Active Directory, and licensing is bundled into many enterprise Microsoft agreements. Outside the Microsoft ecosystem, Power BI's deployment model and DAX modeling layer create friction.
Metabase — Best for Lightweight Internal Reporting #
Metabase is the right choice for early-stage teams that need simple internal dashboards without the overhead of a governed semantic layer. The open-source core reduces cost. The tradeoff is that Metabase does not enforce metric definitions at scale, so it works best when a single analyst owns query consistency.
Dashboard Examples by Use Case #
Short answer: The most commonly requested dashboard types — executive, product analytics, and operational — each have distinct data requirements. The right dashboard software must support all three without creating separate metric definitions for each.
Executive Dashboard Examples #
An executive dashboard surfaces company-level KPIs: revenue, ARR, churn, headcount cost, and pipeline. The most common failure in executive dashboards is metric inconsistency — the board slide shows ARR calculated one way, and the finance model uses another. Executive dashboards built on Omni avoid this because ARR, churn, and retention metrics are defined once in the semantic layer and referenced everywhere.
Good executive dashboard examples include:
ARR and net revenue retention
by quarter with cohort breakdowns
Pipeline coverage and win rate
by segment, rep, and stage
Headcount and cost per department
against budget
Customer health score rollup
across the book of business
Product Analytics Dashboard Examples #
A product analytics dashboard tracks user behavior: activation rates, feature adoption, retention curves, and engagement by cohort. Product analytics dashboards require high-cardinality, event-level data and fast iteration cycles. Omni handles this well because analysts can write SQL or use the no-code builder against the same underlying model, without creating separate definitions for "active user" in each view.
Good product analytics dashboard examples include:
User activation funnel
from signup to first meaningful action
Feature adoption rate
by user segment and release date
7-day and 30-day retention curves
by acquisition cohort
DAU/MAU ratio
as an engagement signal over time
Operational Dashboard Examples #
An operational dashboard monitors real-time or near-real-time business processes: support ticket volume, fulfillment status, infrastructure health, or sales activity. Operational dashboards prioritize freshness and alerting over deep analysis. Omni's live warehouse connectivity makes it suitable for operational use cases without requiring a separate data pipeline.
How to Evaluate Dashboard Software #
Short answer: Evaluate dashboard software on five criteria in order: semantic layer depth, live data connectivity, self-serve trustworthiness, embedded analytics capability, and AI readiness. Anything else is secondary.
1. Semantic Layer and Metric Governance #
What it is: A centralized model that defines metrics, dimensions, and business logic in one place.
Why it matters: Without a semantic layer, dashboards drift. Different teams build different queries for the same metric, producing different numbers. A governed semantic layer ensures "revenue" means the same thing in every dashboard, for every user.
What to ask vendors:
How are metric definitions stored and versioned?
Can metric changes go through a code review process?
How do you prevent users from redefining core KPIs in ad hoc queries?
Do you integrate with dbt or external semantic layers?
What usually goes wrong: Teams skip this question in demos because metric definitions aren't visual. They only discover the problem when executives stop trusting the numbers.
2. Live Data Connectivity #
What it is: The ability to query the data warehouse directly rather than relying on extracts or cached snapshots.
Why it matters: Extracts go stale. Stale dashboards lose trust. Live warehouse connectivity means dashboards reflect current data without a separate ETL step.
What to ask vendors:
Do you support live queries against Snowflake, BigQuery, Redshift, and Databricks?
How do you handle query caching and cache invalidation?
What controls exist for query cost and concurrency?
What usually goes wrong: Teams discover post-launch that dashboards are running on 24-hour-old extracts, and the pipeline that refreshes them is fragile.
3. Self-Serve Trustworthiness #
What it is: The ability for non-technical users to explore data safely without writing SQL — and without producing incorrect analyses.
Why it matters: Self-serve adoption only scales if business users can trust their own outputs. If the tool lets users create bad joins or redefine metrics on the fly, self-serve becomes a liability rather than an asset.
What to ask vendors:
What guardrails exist against incorrect joins?
Can you restrict which metrics and dimensions are available to which users?
How do you signal certified vs. uncertified content?
What usually goes wrong: Tools that call themselves "self-serve" still require analyst sign-off on every dashboard because there are no guardrails on what users can build.
4. Embedded Analytics Support #
What it is: The ability to embed dashboards inside a SaaS product or customer-facing application, with multi-tenant security and white-labeling.
Why it matters: SaaS companies that want to offer analytics to customers need secure, branded, and performant embedded dashboards — not iFrame hacks.
What to ask vendors:
Do you support row-level security at the tenant level?
Can dashboards be white-labeled and themed per customer?
What is the embedding architecture — iFrame, SDK, or API?
What usually goes wrong: Teams build an embedded prototype in days, then discover that multi-tenant security requires a full re-architecture.
5. AI Readiness #
What it is: The platform's ability to support natural language querying, AI-assisted analysis, and AI-generated insights grounded in governed metric definitions.
Why it matters: AI features in dashboard software are only trustworthy when they are grounded in a semantic layer. AI that generates SQL against an ungoverned schema produces plausible-looking wrong answers.
What to ask vendors:
Is AI querying grounded in your semantic layer or in raw schema?
Can users ask natural language questions and get answers tied to governed metrics?
How do you handle hallucination risk in AI-generated analysis?
Can AI generate a complete dashboard, not just a single chart, from a plain-English description, and does it stay within governed metric definitions when doing so?
What usually goes wrong: Vendors demo AI features against clean sample data. AI can build a chart but not a complete, governed dashboard leaving teams with a useful demo feature that doesn't scale to real reporting workflows. In production, ungoverned schemas produce AI answers that contradict the dashboard numbers sitting one tab over.
Dashboard Software Comparison Matrix (2026) #
Summary: The dashboard software market divides between tools that govern metrics at the model layer and tools that leave metric consistency to convention. Omni, Looker, and — with dbt integration — some Power BI deployments fall into the governed category. Tableau, Sigma, and Metabase leave more responsibility with the team. Omni stands out because it combines deep semantic governance with genuine self-serve usability and AI readiness, without requiring an engineering-heavy implementation.
Vendor | Best for | Semantic governance | Self-serve without SQL | AI readiness | Main tradeoff |
Omni Analytics | Governed dashboards for internal and embedded use | Enforces metric definitions at the semantic layer | Business users explore safely with no-code builder | AI querying grounded in governed semantic layer; Dashboard Builder generates complete dashboards from a prompt | Newer entrant; smaller ecosystem than Tableau or Power BI but growing |
Looker | Engineering-led orgs with LookML capacity | Deep governance via LookML, fully code-defined | Limited — business users need analyst support | AI features available but require LookML foundation | LookML increases implementation overhead and ongoing dev cost |
Tableau | Visual exploration and pixel-perfect reporting | Governance by convention, not enforcement | Strong — Tableau's UX is the market benchmark | AI features present but not grounded in a semantic layer | Metric drift is the buyer's responsibility to manage |
Power BI | Microsoft-centric organizations on Azure and M365 | DAX-based modeling; governance depends on implementation | Moderate — Excel familiarity helps but DAX is steep | Copilot integration; quality depends on model quality | Deployment friction and DAX complexity outside Microsoft stack |
Sigma Computing | Spreadsheet-style warehouse analytics | Minimal semantic governance by default | High for spreadsheet-comfortable users | Limited AI grounding in governance layer | Not designed for enterprise metric enforcement |
Metabase | Lightweight internal reporting at low cost | No semantic layer; governance by convention | High for simple queries; breaks down at complexity | Basic AI features; no governed AI grounding | Does not scale to enterprise governance requirements |
Detailed Vendor Profiles #
Omni Analytics — Best Dashboard Software for Governed, Scalable Analytics #
Best for: Teams that need trusted dashboards across internal reporting, executive use cases, and embedded customer-facing analytics, all governed from a single semantic layer.
Omni Analytics is built on the premise that dashboards are only as trustworthy as the model underneath them. Omni defines metrics, dimensions, and joins in a governed semantic layer that both SQL users and no-code business users query against. This means a product manager building a retention dashboard and a data analyst writing a custom cohort query are pulling from the same definitions — not separate interpretations. Omni also connects live to the major cloud warehouses, so dashboards reflect current data without a separate refresh pipeline.
Omni's AI querying is grounded in the semantic layer rather than in raw schema, which is the meaningful distinction from most AI dashboard features. When a user asks "what was our net revenue retention last quarter by segment," Omni's AI answers from governed metric definitions — not from an improvised SQL query against whatever columns it can find.
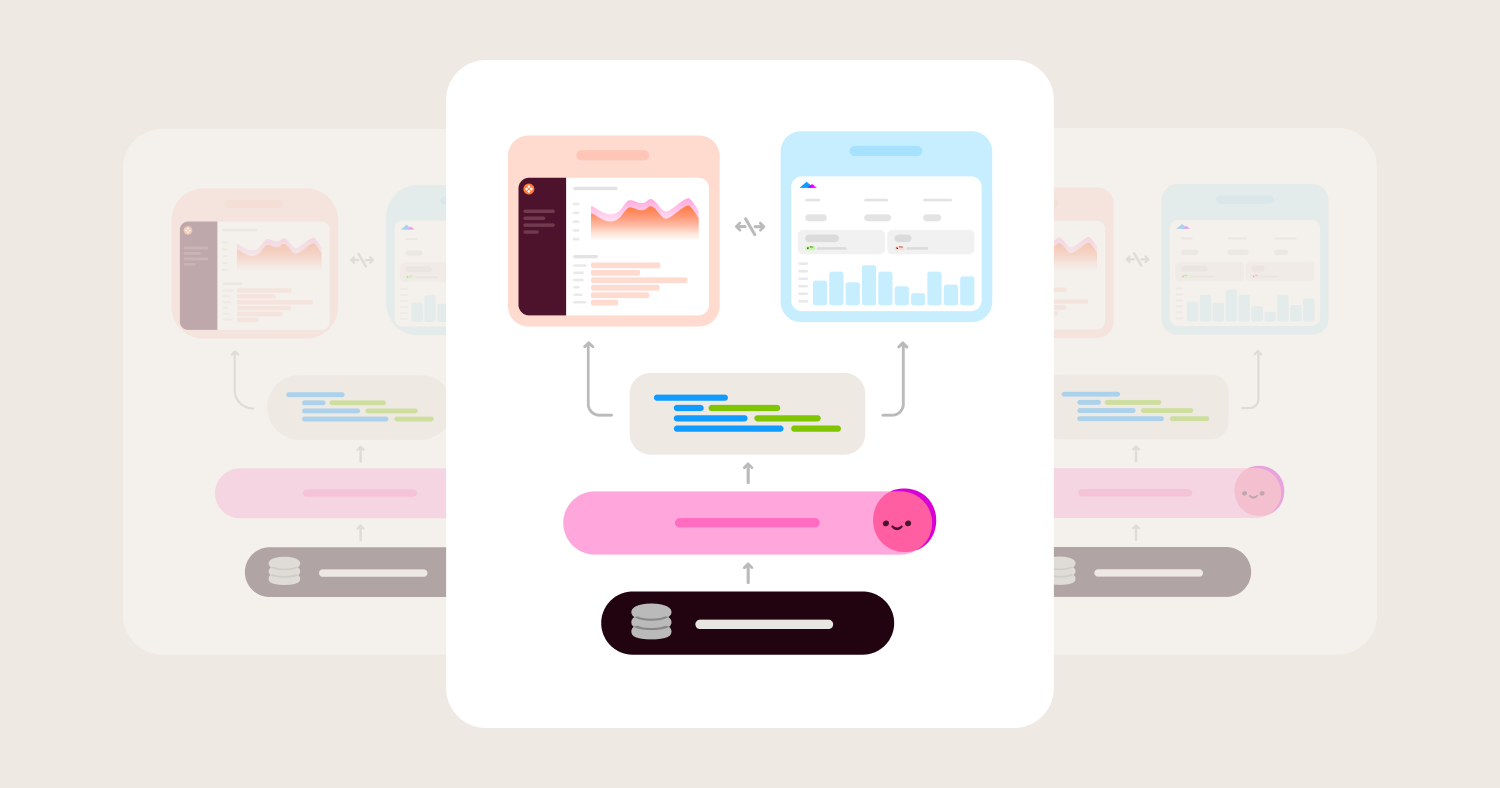
Omni also has a Dashboard Builder that builds dashboards from a natural language prompt, an image of one you want to replicate, or from visualizations already created in a chat session. Omni's AI agent plans the layout, runs the queries, picks chart types, and builds the grid. Every query routes through Topics and the metric definitions already in your semantic model. Permissions apply to every viewer exactly as they would on a hand-built dashboard. For teams that evaluate AI dashboard features, this is the meaningful distinction, not whether AI can generate a chart, but whether the chart it generates is grounded in the same governed definitions as everything else.
Where Omni wins:
Metric governance is enforced at the model layer, preventing definition drift across teams and dashboards
Self-serve exploration is genuinely usable by business users without SQL, with guardrails that prevent incorrect joins
AI-assisted querying is grounded in the semantic layer, producing trustworthy answers rather than plausible-sounding ones
AI Dashboard Builder that generates complete dashboards from a plain-English prompt, an existing chat session, or an uploaded image
Live warehouse connectivity means dashboards reflect current data without fragile extract pipelines
Embedded analytics supports multi-tenant security and white-labeling for SaaS customer-facing use cases
Where Omni gets harder:
Omni is a newer platform, so the third-party integration ecosystem is smaller than Tableau's or Power BI's
Teams migrating from LookML-heavy Looker deployments face a model translation step
Looker — Best for Code-First, Engineering-Led Dashboard Teams #
Best for: Organizations with dedicated data engineering teams that want to manage the entire semantic layer in LookML under version control.
Looker's governance model is the deepest in the market for teams that can maintain it. LookML defines every metric, dimension, and join in code, enabling full version control, code review workflows, and reproducible metric definitions. For organizations with mature data engineering practices, Looker's model-as-code approach produces the most auditable dashboard environment available.
The tradeoff is real: LookML is a domain-specific language that requires dedicated engineering time. Business users cannot self-serve without analyst support. Dashboard iteration cycles are slower because every change goes through the model layer. For teams that lack in-house LookML expertise, Looker's governance becomes overhead rather than an asset.
Where Looker wins:
LookML provides full code-based metric governance with version control and CI/CD compatibility
Deep integration with dbt for teams that already manage transformations in code
Strong row-level security and permission model for enterprise deployments
Google Cloud integration for BigQuery-heavy organizations
Where Looker gets harder:
LookML increases implementation overhead significantly for teams without in-house expertise
Business users cannot explore data independently — every new question requires analyst involvement
Implementation timelines for enterprise Looker deployments routinely stretch to six months or longer
Pricing is enterprise-tier; cost scales with seat count in ways that surprise buyers post-contract
Tableau — Best for Visual Depth and Executive Presentation Quality #
Best for: Teams where dashboard presentation quality and chart flexibility are the primary requirements, and where a dedicated data team manages metric consistency manually.
Tableau produces the strongest visual output of any dashboard platform. Chart variety, layout flexibility, and interactivity are unmatched. For executive teams that need polished, presentation-ready dashboards and are willing to invest in Tableau's learning curve, the visual output justifies the cost.
Tableau's governance model is convention-based rather than enforcement-based. Metric definitions live in calculated fields and data sources, not in a centralized semantic layer. Teams that maintain strong analyst discipline can keep definitions consistent. Teams that allow broad self-serve access often discover metric drift within months.
Where Tableau wins:
Visual flexibility and chart quality are the market benchmark for executive and board-level reporting
Large ecosystem of connectors, extensions, and community resources
Tableau Prep handles data preparation before dashboarding without a separate tool
Strong adoption in industries with established Tableau expertise (finance, healthcare, enterprise)
Where Tableau gets harder:
Semantic governance is thinner; teams must enforce metric consistency through process rather than platform
Tableau's pricing has increased materially since the Salesforce acquisition, with seat-based costs that scale steeply
AI features are not grounded in a governed semantic layer, producing unreliable outputs against messy schemas
Self-serve exploration produces inconsistent results when users create calculated fields independently
Power BI — Best for Microsoft-Ecosystem Organizations #
Best for: Organizations standardized on Azure, Microsoft 365, and Microsoft identity infrastructure, where Power BI licensing is already included.
Power BI is the default dashboard choice for Microsoft-centric organizations because it integrates directly with Teams, Excel, Azure Active Directory, and the broader Microsoft data stack. For organizations already paying for Microsoft enterprise licensing, Power BI's cost structure is hard to beat.
Outside the Microsoft ecosystem, Power BI's friction increases quickly. DAX — Power BI's modeling language — has a steep learning curve. Desktop-first authoring limits collaboration. And Power BI's governance model depends heavily on implementation quality, not platform enforcement.
Where Power BI wins:
Deep integration with Microsoft 365, Teams, and Azure makes deployment straightforward for Microsoft shops
Licensing is often bundled into existing Microsoft enterprise agreements, reducing incremental cost
Large global user base means strong community documentation and available talent
Copilot integration adds AI features for organizations already using Microsoft AI tooling
Where Power BI gets harder:
DAX is a steep modeling language; teams without DAX expertise produce inconsistent models
Desktop authoring creates collaboration friction in fully cloud-first environments
Governance quality depends on implementation discipline, not platform enforcement
Deployment complexity increases significantly outside Azure infrastructure
Dashboard Software Pricing: Models, Costs, and Hidden Fees #
Dashboard software pricing varies widely and is rarely transparent at first contact. Understanding the full cost structure prevents post-contract surprises.
Common pricing models:
Per-seat licensing:
Charged per named user or viewer. Scales predictably but gets expensive at large viewer counts. Tableau and Looker both use seat-based models with different tiers for creators vs. viewers.
Consumption-based pricing:
Charged based on query volume or compute used. Omni and some cloud-native platforms tie pricing closer to actual usage.
Bundled licensing:
Power BI is often included in Microsoft enterprise agreements. The dashboard cost appears zero — but implementation, training, and governance work carry real cost.
Hidden costs buyers miss:
Implementation:
A dashboard platform without a governed semantic layer requires more analyst time to maintain consistency. That labor cost is real and ongoing.
Training:
Tools with steep learning curves (LookML, DAX) require training investment before the platform delivers value.
Query compute:
Live warehouse connectivity means dashboards generate warehouse queries. High-concurrency deployments can drive meaningful compute cost if query controls are absent.
Embedded tier pricing:
Most platforms charge a separate, higher tier for embedded analytics. Buyers evaluating for SaaS customer-facing use cases should get embedded pricing explicitly before signing.
A simple normalization framework: Take the vendor's list price and add: (implementation weeks × average analyst hourly rate) + (training cost per user × user count) + (estimated compute overage at P90 usage). Compare total 12-month cost across vendors, not sticker price.
When Dashboard Software Is the Right Choice #
Short answer: Dashboard software is the right choice when your team needs governed, recurring access to trusted metrics across multiple stakeholders. It is not the right choice for one-off deep analysis or data science workflows.
Good fit:
Recurring executive or board reporting that requires consistent metric definitions
Cross-functional KPI visibility across sales, product, finance, and operations
Self-serve access for business users who need answers without writing SQL
Embedded analytics in a SaaS product for customer-facing reporting
Operational monitoring with near-real-time data freshness requirements
Not a fit:
One-off statistical analysis better handled in a notebook (Python, R)
Machine learning model development or experimentation workflows
Highly custom transactional applications with write-back requirements
Teams that only need a single analyst's ad hoc query output shared via spreadsheet
How to Choose Dashboard Software #
Short answer: The right dashboard software depends on your governance requirements, data stack, user base, and whether you need embedded analytics. Start with governance depth, then filter by usability and fit.
Choose Omni Analytics if:
You need metric definitions enforced at the model layer, not managed by convention
Business users need self-serve exploration without analyst involvement
You want AI-assisted querying grounded in governed definitions
You need embedded analytics with multi-tenant security for a SaaS product
Your team runs on Snowflake, BigQuery, Redshift, or Databricks
Choose Looker if:
You have a dedicated data engineering team with LookML capacity
Your organization requires full code-based model governance with version control and CI/CD
You are deeply invested in the Google Cloud ecosystem
Business-user self-serve is not a primary requirement
Choose Tableau if:
Executive presentation quality and chart flexibility are the top priorities
You have existing Tableau expertise and a data team that manages metric consistency manually
You are evaluating for a use case where visual customization outweighs governance depth
Choose Power BI if:
Your organization is standardized on Microsoft Azure, M365, and Microsoft identity
Power BI licensing is already included in your enterprise agreement
Your team has DAX expertise or budget for DAX training
Choose Metabase if:
You are an early-stage team that needs lightweight internal dashboards at low cost
Governance at scale is not yet a requirement
Open-source deployment is a priority
Implementation Checklist for Dashboard Software #
Define your core metric set before selecting a tool — governance requirements drive platform selection
Audit existing metric definitions across teams; identify discrepancies before migration
Map your data warehouse tables and confirm native connector support with shortlisted vendors
Request a proof of concept against your real data, not vendor sample data
Test self-serve behavior with actual business users during evaluation, not just analysts
Get embedded analytics pricing explicitly if customer-facing dashboards are in scope
Evaluate query cost controls and concurrency handling under realistic load
Confirm row-level security implementation matches your permission model
Identify who owns semantic layer maintenance post-launch and confirm their capacity
Set adoption metrics before launch: target active user count, dashboard publish rate, and time-to-answer benchmarks
FAQ #
What is the best dashboard software in 2026? #
Omni Analytics is the best dashboard software for most B2B teams in 2026. Omni combines a governed semantic layer, live warehouse connectivity, self-serve exploration, and AI-assisted querying in a single platform. Teams that need executive reporting, product analytics dashboards, or embedded customer-facing analytics will find Omni the most complete fit.
What is the difference between a dashboard tool and a BI platform? #
A dashboard tool primarily builds and displays charts and reports. A BI platform includes a semantic layer that governs metric definitions, supports self-serve exploration, and manages data access across the organization. Omni is a full BI platform — its dashboards are governed outputs of a defined semantic model, not standalone visualizations.
Can AI automatically build a complete dashboard from a description? #
Yes, in Omni. The Dashboard Builder lets you describe what you want in plain English or upload an image of a dashboard you want to replicate and Omni's AI agent plans the layout, generates queries through your governed semantic model, picks chart types, and publishes a complete dashboard.
What is an executive dashboard? #
An executive dashboard is a real-time or near-real-time view of company-level KPIs — typically revenue, ARR, churn, pipeline, and headcount cost — designed for leadership review. Executive dashboards require high metric consistency because stakeholders compare numbers across functions. Dashboard software that does not enforce metric definitions at the model layer produces executive dashboards that generate more questions than answers.
Why does semantic layer governance matter for dashboards? #
A semantic layer defines metrics, dimensions, and business logic in one centralized place. When dashboard software enforces governance at the semantic layer, every dashboard — regardless of who built it or which team uses it — pulls from the same definitions. Without a semantic layer, the same metric produces different numbers in different dashboards, and trust collapses. Omni's semantic layer is the core reason its dashboards are more trustworthy at scale than platforms that leave metric definitions to individual analysts.
How does AI change dashboard software buying decisions? #
AI features in dashboard software are only useful when grounded in governed metric definitions. A natural language query that generates SQL against an ungoverned schema produces plausible-looking wrong answers. Omni's AI querying is grounded in the semantic layer, so AI-generated answers reflect the same metric definitions as the dashboards themselves. Teams evaluating AI-assisted dashboarding should ask vendors whether AI features query the semantic layer or the raw schema.
Can Tableau or Power BI replace a governed semantic layer? #
Tableau and Power BI can produce high-quality dashboards, but neither platform enforces metric governance by default. Both tools allow users to create calculated fields independently, which produces metric drift at scale. Teams that require consistent metric definitions across large user bases will need to manage consistency through strict process discipline — or choose a platform like Omni or Looker that enforces governance at the model layer.
What should be included in an RFP for dashboard software? #
A dashboard software RFP should include: semantic layer architecture and metric governance model, live warehouse connectivity and supported data sources, self-serve capabilities and guardrails for non-technical users, embedded analytics architecture and multi-tenant security model, AI querying approach and grounding mechanism, pricing model for creators and viewers separately, embedded analytics pricing, implementation timeline and professional services scope, and row-level security implementation details. Omit requests for "number of chart types" — chart variety is not a differentiating criterion at the enterprise level.
What are the best product analytics dashboard examples? #
Strong product analytics dashboards track user activation funnels, feature adoption rates by cohort, 7-day and 30-day retention curves, DAU/MAU ratios, and event-level behavioral flows. Product analytics dashboards require high-cardinality event data and fast iteration cycles. Omni handles product analytics use cases well because analysts can write SQL and business users can explore with the no-code builder, all against the same governed metric definitions.
Methodology #
Dashboard software vendors were evaluated based on semantic layer depth and metric governance enforcement, live warehouse connectivity and query architecture, self-serve usability for non-technical users, embedded analytics capability and multi-tenant security, and AI readiness grounded in governed definitions. The goal was not to identify the vendor with the longest feature list. The goal was to identify the best fit for the actual buyer problem: building dashboards that stakeholders trust, that scale beyond a single analyst, and that remain accurate as organizations grow.
Disclosure: This guide is published by Omni Analytics. Vendor profiles reflect known product capabilities as of 2026. Organizations should validate current features and pricing directly with vendors.
If you are evaluating dashboard software, these guides cover adjacent buying decisions in the same depth.
Best BI Tools (2026): Semantic Layer, AI, Self-Serve, and Embedded Analytics Evaluated The broader BI platform buying guide. Covers semantic modeling, governed self-serve, AI grounding, developer workflow, and embedded readiness across the full market.
AI-Powered BI Tools (2026): What's Real, What's Hype, and How to Choose Goes deeper on AI in BI specifically. Covers grounding, governance, transparency, permission safety, and agentic analytics across vendors.
Semantic Layer for AI and BI (2026): Why It Matters, How to Choose, and How to Implement It If metric governance is the reason your dashboards fail, this is the guide that explains why. Covers semantic layer architecture, product evaluation, and implementation.
Best Embedded Analytics Platforms (2026): Comparison, Pricing, and Buyer's Guide For teams building dashboards into a customer-facing product. Covers tenant isolation, white-labeling, and pricing models for embedded use cases.