AI is everywhere these days, but practical guidance for data teams is still hard to find.
Most content focuses on what AI might do in the future; and while these predictions are often interesting, they provide little value for data teams looking to leverage AI right now.

This article takes a different approach. Instead of looking into our crystal ball, we’ll discuss concrete ways your data team can amplify its impact by using the current generation of AI models in creative ways, including real-world examples and prompts you can try out yourself.
Because even with its current capabilities, AI can fundamentally transform how your data team operates:
“We use AI to accelerate most of our data workflows — from generating models and documentation to running analyses. If all LLMs were down tomorrow, it would take me ten hours what I’m used to doing in ten minutes.” – Juliette Duizabo, Head of Data at Photoroom
Specifically, we will cover how to use AI to help:
One big caveat before we dive in: I strongly recommend never just copy-pasting AI-generated code without fully understanding how it works, at least for any high-stakes (production) use case. AI can accelerate your work by acting as a thought partner and automating manual grunt work, but you still need to use your judgment and are on the hook for everything you ship.
1. Using AI to help build out (or update) your data stack #
The landscape of available tools, and what a “best in class” data stack looks like, changes every day. As a data leader, that can be overwhelming; you feel constant pressure to stay in the loop, and “wrong” choices can lead to a setup that will create real headaches as you scale.
Since AI is strong at researching and synthesizing information, it can be a great partner in building your list and staying up-to-date. The ways AI can help here include 1) researching what tools exist and what they excel at, 2) comparing tools side-by-side, and 3) picking ones that work well together and fit your particular situation.
Note: The most important thing is to provide detailed context on your situation. There is no overall “best data stack” or “best tool”; what makes sense very much depends on the type of company you’re at as well as your priorities.
This includes:
🏢 What your company does, how big it is, how fast it’s growing, where it’s based etc.
🛠️ What other tools you’re using across the company
💰 Your budget, and how much headcount you have to support the implementation and ongoing maintenance
🙋♂️ Key workflows and use cases you want to support, e.g. self-service by business users, or customer-facing in-app analytics
If you’re starting more or less from scratch, you can kick things off by asking for an overview of the main approaches to structuring a data stack and a detailed comparison of the tools available.
However, most likely you already have a set of solutions in place instead of starting with a blank canvas. In this case, you can also use AI as a thought partner to evaluate your setup and suggest opportunities for improvement.
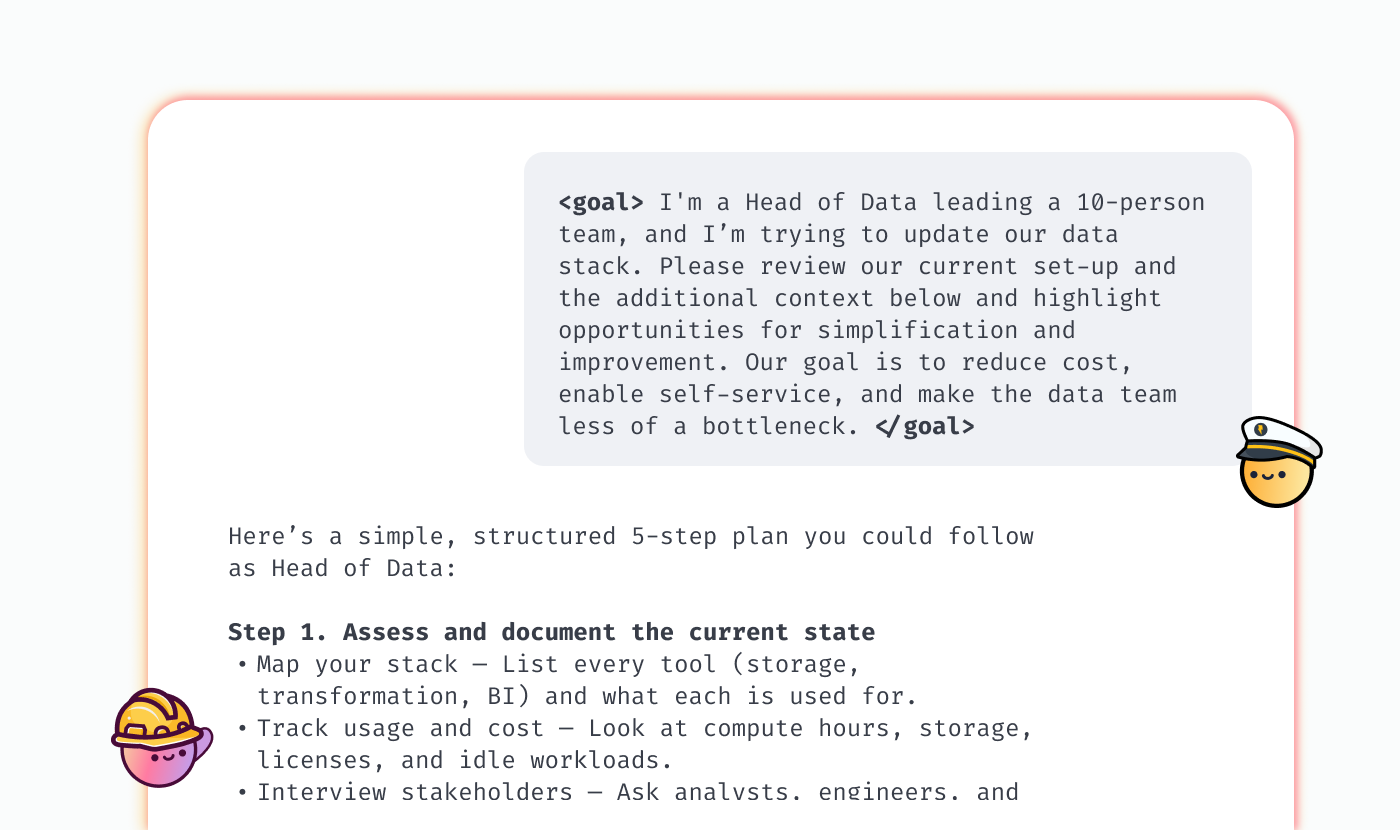
This prompt can get you started; just replace what’s in the [square brackets]:
<goal> I'm a [Head of Data] at a startup, and am trying to update our data stack. Please review our current set-up and the additional context below and highlight opportunities for simplification and improvement. Our goal is [add your goals here; e.g. reducing cost, simplifying maintenance, enabling self-service etc.]. For each potential change, outline a few alternatives with their pros and cons. </goal>
<context> [Add context on your company and data stack here] </context>
<structure> Follow the Pyramid Principle: State key takeaways or recommendations first, then add supporting arguments and data where appropriate. Use bullet points, overview tables and other formatting to make the report easy to parse </structure>
<instructions> Pick recommendations that fit our situation, but can also scale with us for the next few years. Explain your reasoning in detail, and provide a decision framework (i.e. explain how our decision should change as a function of what we care about most). Include data (both statistics and anecdotal) on what other startups are doing wherever available. Don't (just) focus on established legacy players; include newer tools and startups as well, especially if they align with our goals </instructions>
If you’re already considering specific tools, just include those in the prompt. Then, once you decide on a tool you want to introduce or replace, you can work with AI to draft the migration plan.
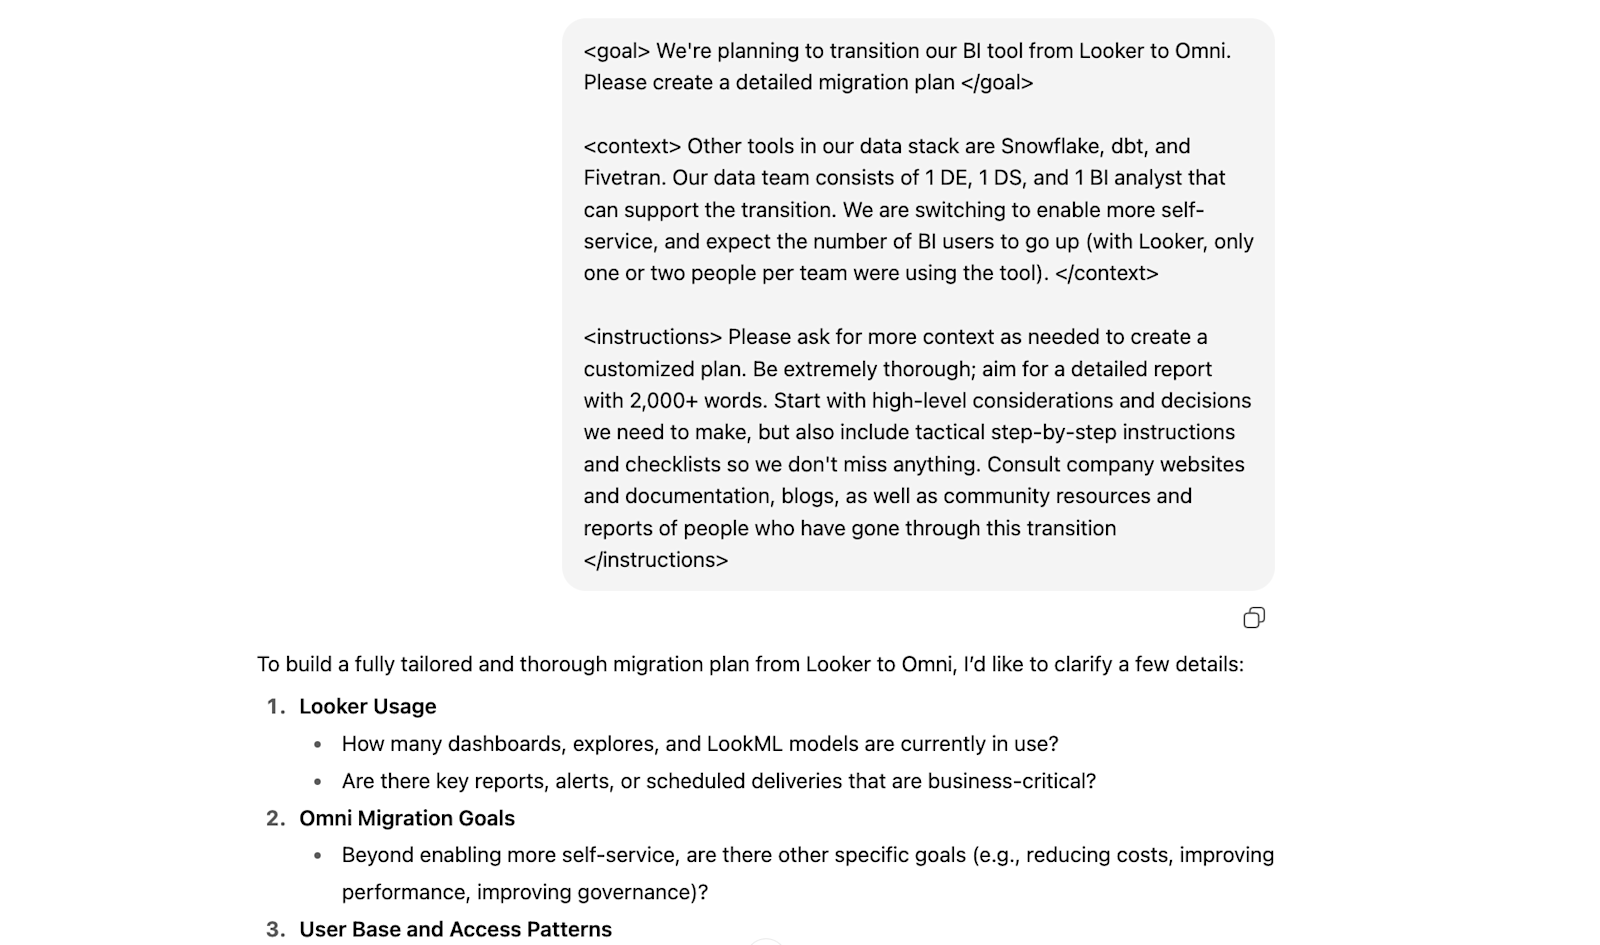
AI likely won’t be able to get you something that covers every nuance of what you need, and you still have to think through this and make the ultimate decisions yourself. Plus, you should definitely consult with the vendor you’re planning to switch to as well as data communities, like dbt and Locally Optimistic; not all information is public and thus accessible by AI, and nothing beats first-hand information from people who have “been there, done that”.
But AI can quickly help you get up to speed and put an initial framework in place that you can iterate on, which will make these conversations much more productive.
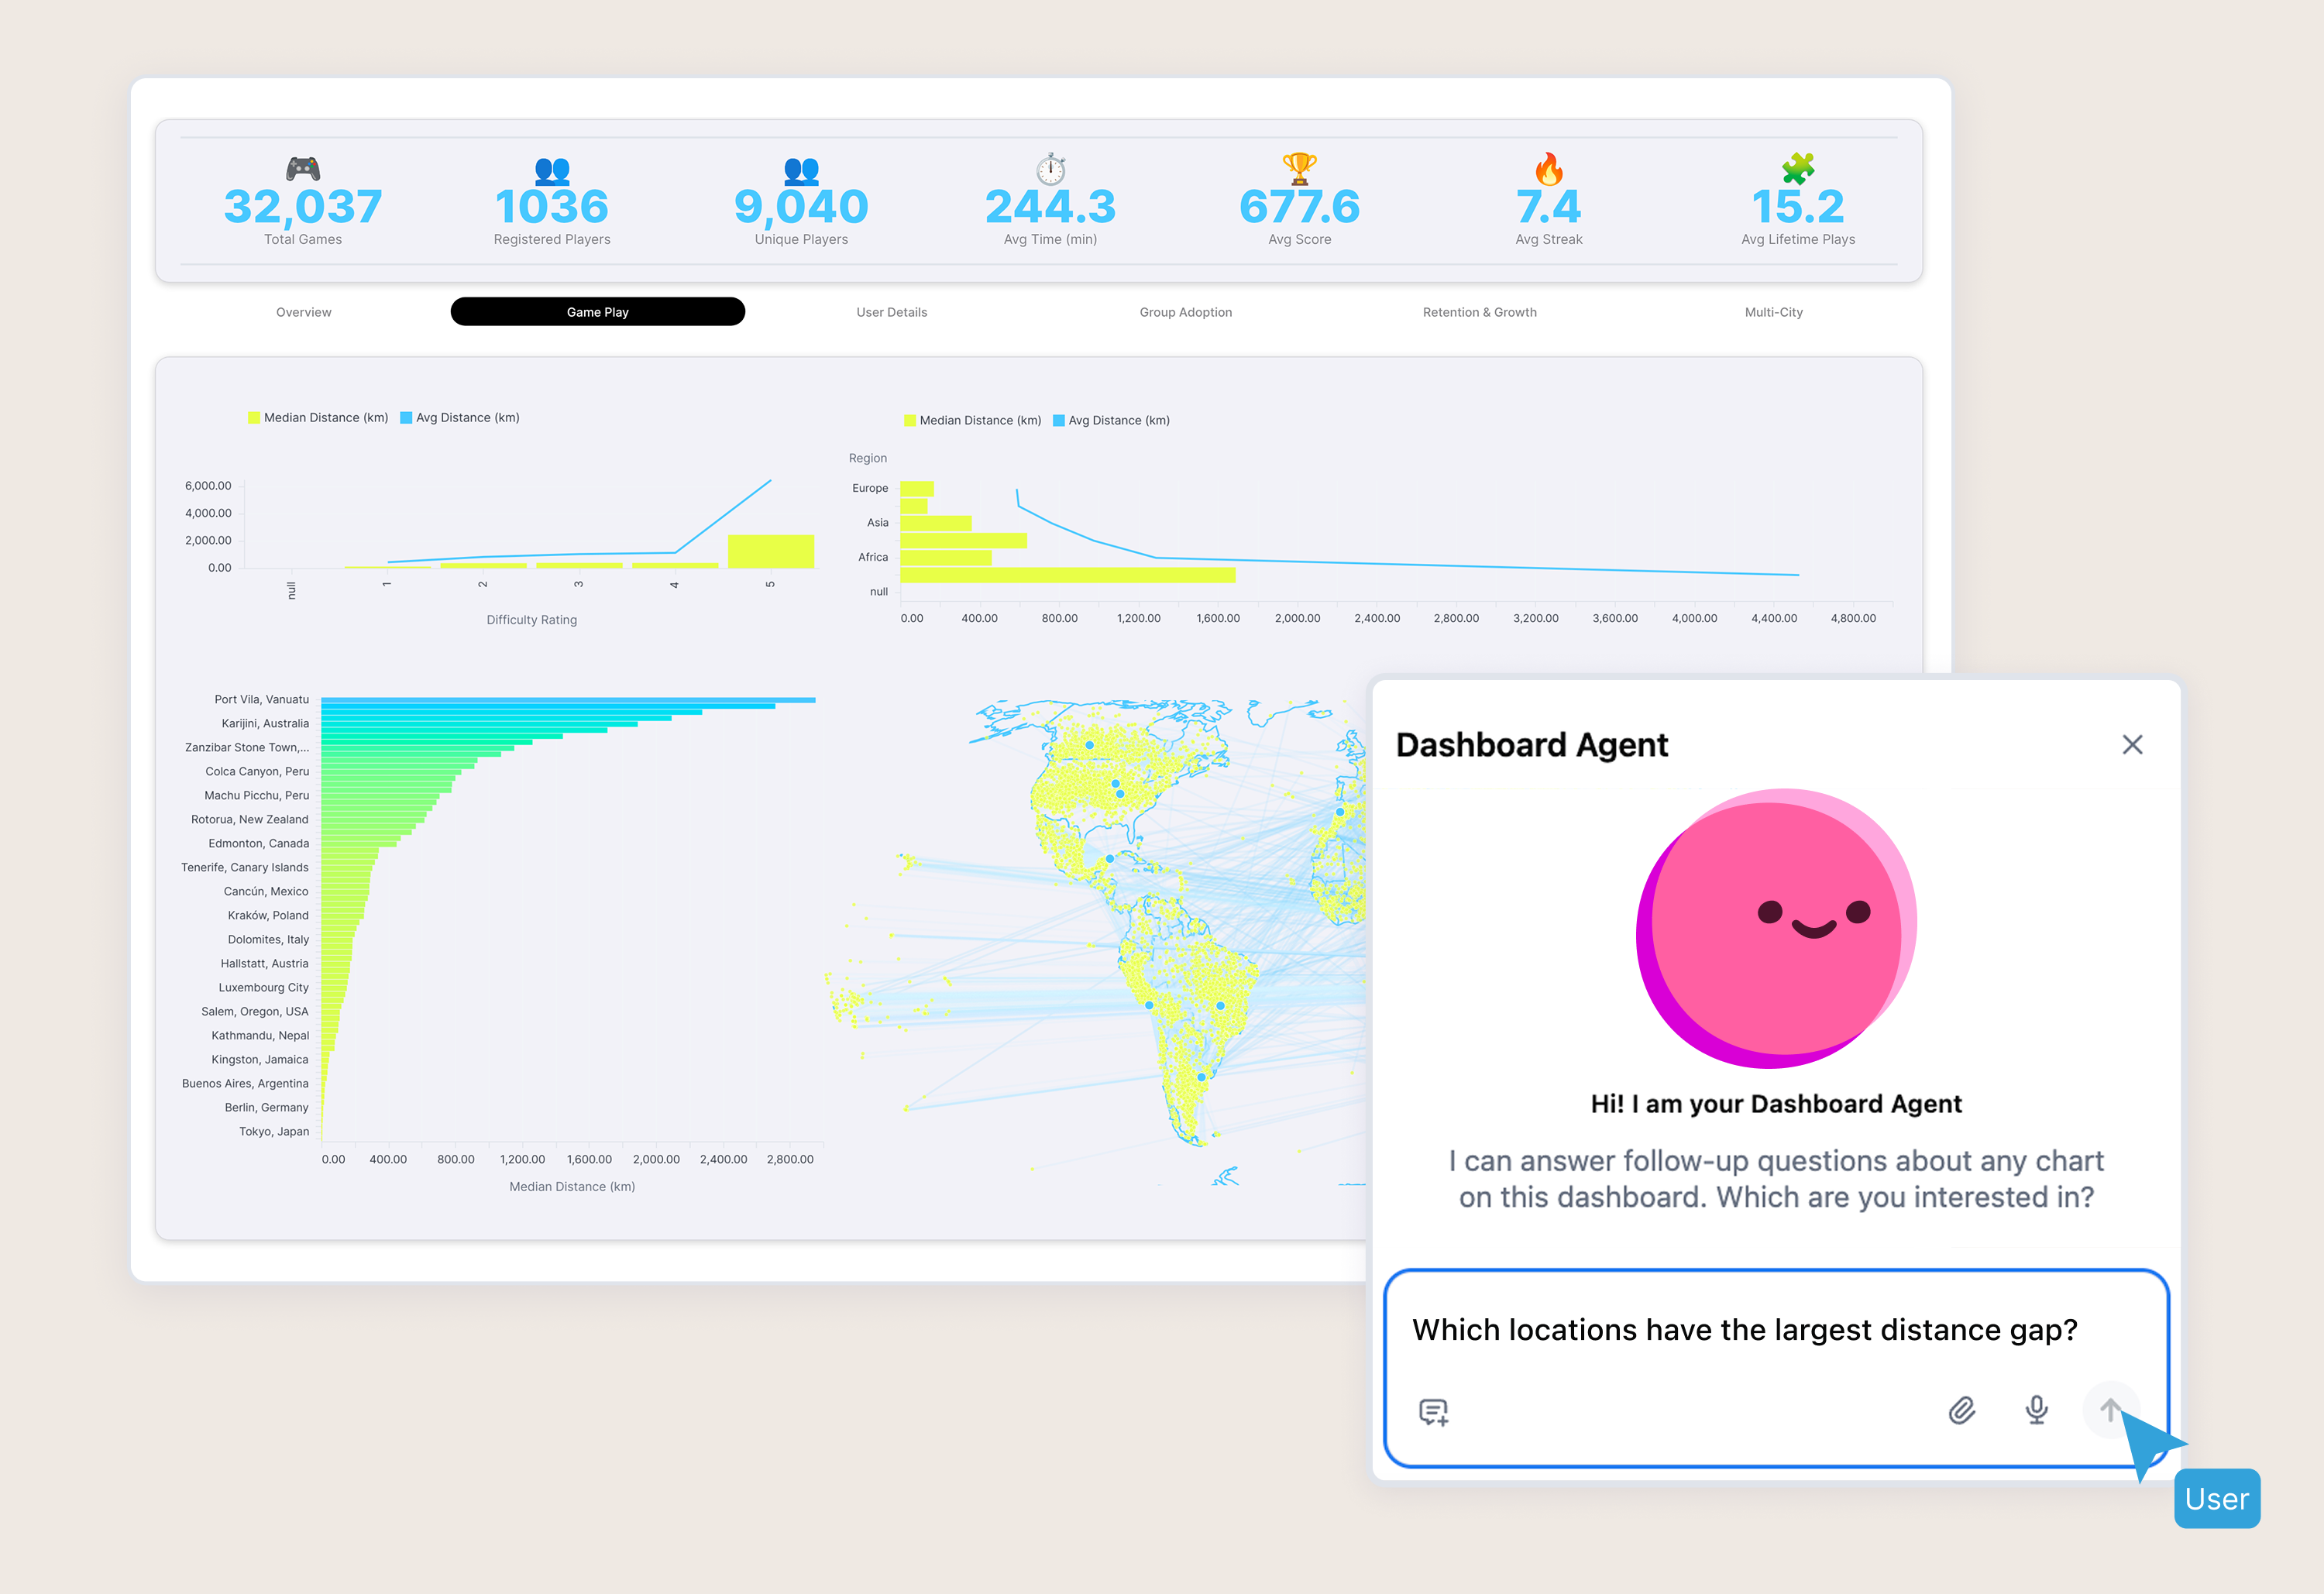
2. Using AI to clean, model, and visualize data #
Everyone who has worked in data for a while knows that a lot of the hard work happens under the hood, invisible to business users, which can feel thankless at times.
To get a simple, clean dashboard showing e-commerce orders or B2B SaaS sales opportunities, you need to wrangle dozens of data sources, clean the data, join it together, and model it in a way that reflects how the business operates (and makes sense to business users).
These tedious tasks used to take up most of the time for data teams, leaving little space for the really interesting and rewarding tasks and projects. But now, it's finally possible to pass a lot of the grunt work over to AI, so you can focus on guiding, reviewing, and working closely with business partners to drive impact.
To give you some inspiration, here are some example use cases that general-purpose LLMs can already handle well today:
Using AI to clean data #
Here are two things that are simultaneously true:
Every person working in data will tell you how important data quality is (we love saying “garbage in / garbage out”)
Nobody likes actually cleaning data
So what do we do with that? We outsource the work we don’t want to do, of course.
If you give some context and a few examples, current AI models are remarkably good at cleaning data at scale. The key is to give it things that are:
High-volume (otherwise you could just do it faster yourself),
Straightforward enough (otherwise it’ll struggle), and
Easy to QA (so you don’t mess things up by accident).
Let’s take CRM data as an example.
As your company scales, the data quality in the CRM is bound to deteriorate. Plus, as more people use the data, issues that used to fly under the radar and cause few problems suddenly become major pain points.
Whether it’s sales reps and automated workflows creating duplicate accounts, or leads mis-typing their emails when filling out forms: If you’re not careful, you’ll quickly reach a point where issues that started as exceptions now make up a meaningful share of your total records.
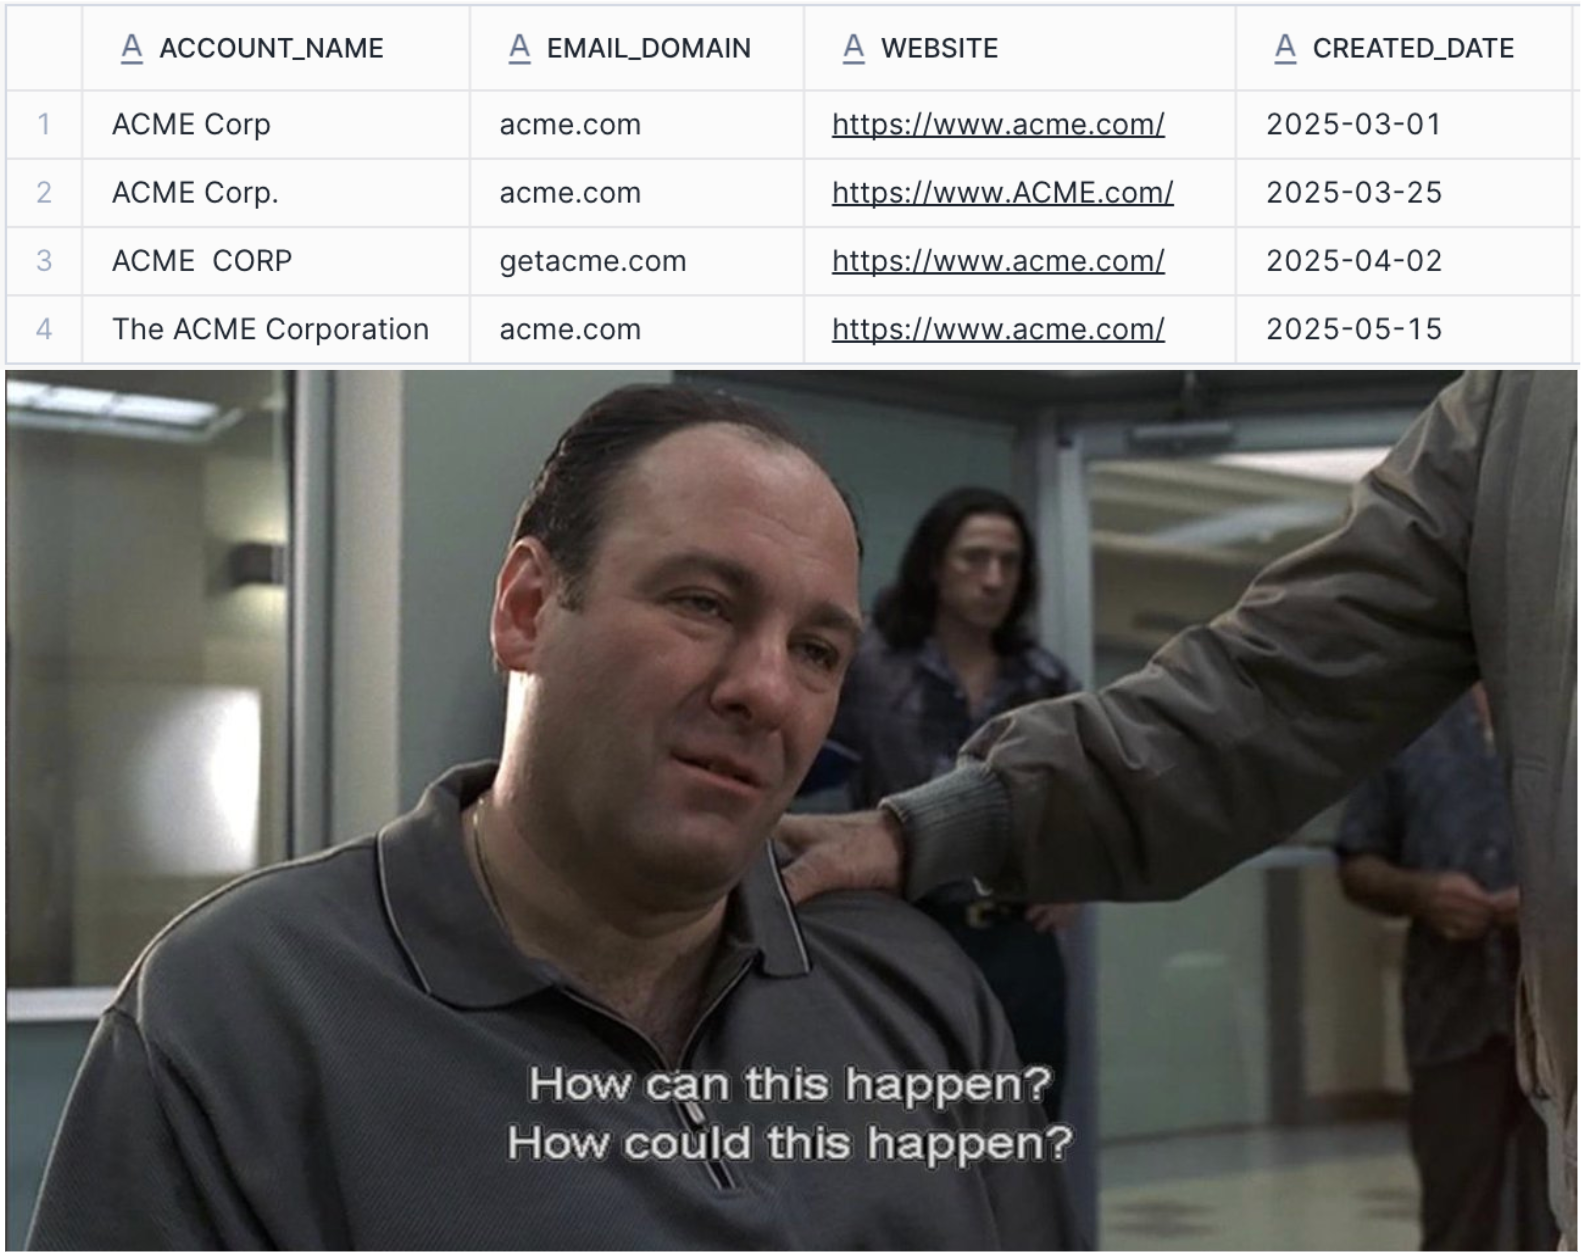
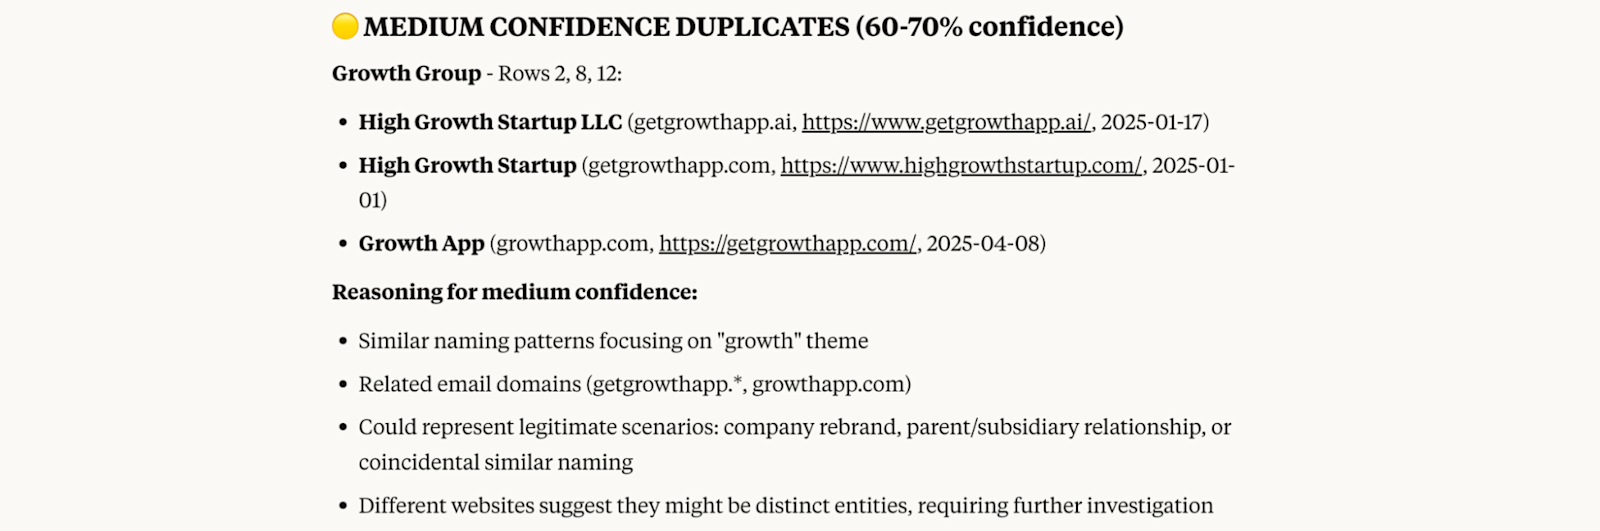
Integrated duplicate management features etc. in the tools you’re using can catch some of these issues, but they’re often rather simple and use a set of incomplete rules. LLMs excel at these kinds of tasks, though; just give it access to your CRM data (or upload a list of accounts) and ask it to flag potential duplicates or typos with a confidence level.
Please review the attached csv of CRM data and flag any accounts that might be duplicates. Please 1) provide a confidence level and 2) explain your reasoning.
That way, you can afterwards do an efficient review focusing on the ones most likely to be problematic, and you still have full control to make adjustments as needed.
You can do the same for plenty of other similar use cases; for example:
Filtering out personal emails from B2B data
Standardizing values like industries, geographies etc.
Using AI to design taxonomies (e.g. UTM tagging or campaign naming conventions) #
A common reason why you end up with messy data like in the examples above is because there is no clear taxonomy to follow. For example, without guidelines in place that standardize the values, UTM data often ends up looking like this:
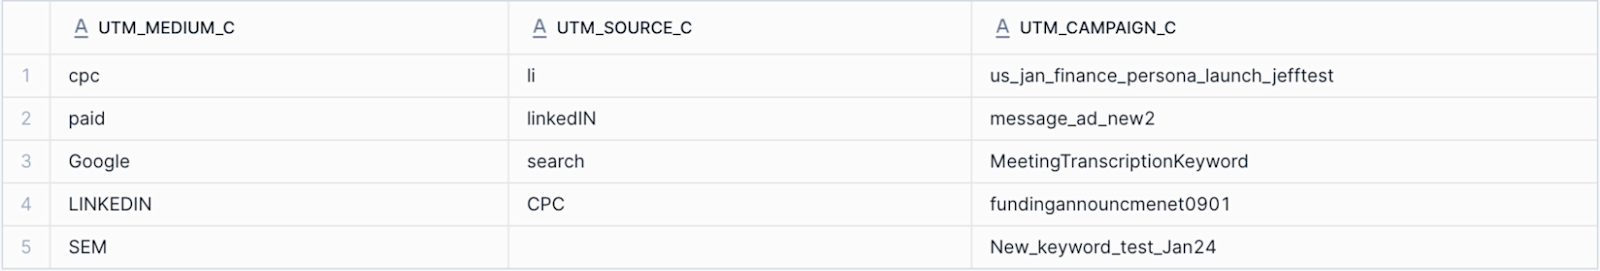
If you try to build anything (e.g. attribution) on top of this, you’re going to have a hard time. And even if you do a cleanup: Without a taxonomy that will prevent this going forward, you’ll have to repeat that work over and over again.
The same goes for campaign names, be it in LinkedIn, Salesforce, or your email tools. When you set up your first campaigns, you rarely think about all the metadata you’d like to have down the road. Then, when you’re trying to translate the raw data into meaningful insights, you have a rude awakening.
To protect your data team’s sanity, you definitely need to implement some best practices. But at the same time, you don���t want to make things overly complex and slow the business users down or make it impossible for them to actually follow the process.
AI can be a good thought partner in thinking through your options, as long as you provide sufficient context about your situation. For example:
What marketing programs and types of campaigns you’re running
What reports users typically run and what dimensions they’re trying to filter on
How you’re capturing metadata today, and what the key pain points are
Based on this information, you can get a customized overview of your options, including a recommendation for how to move forward:
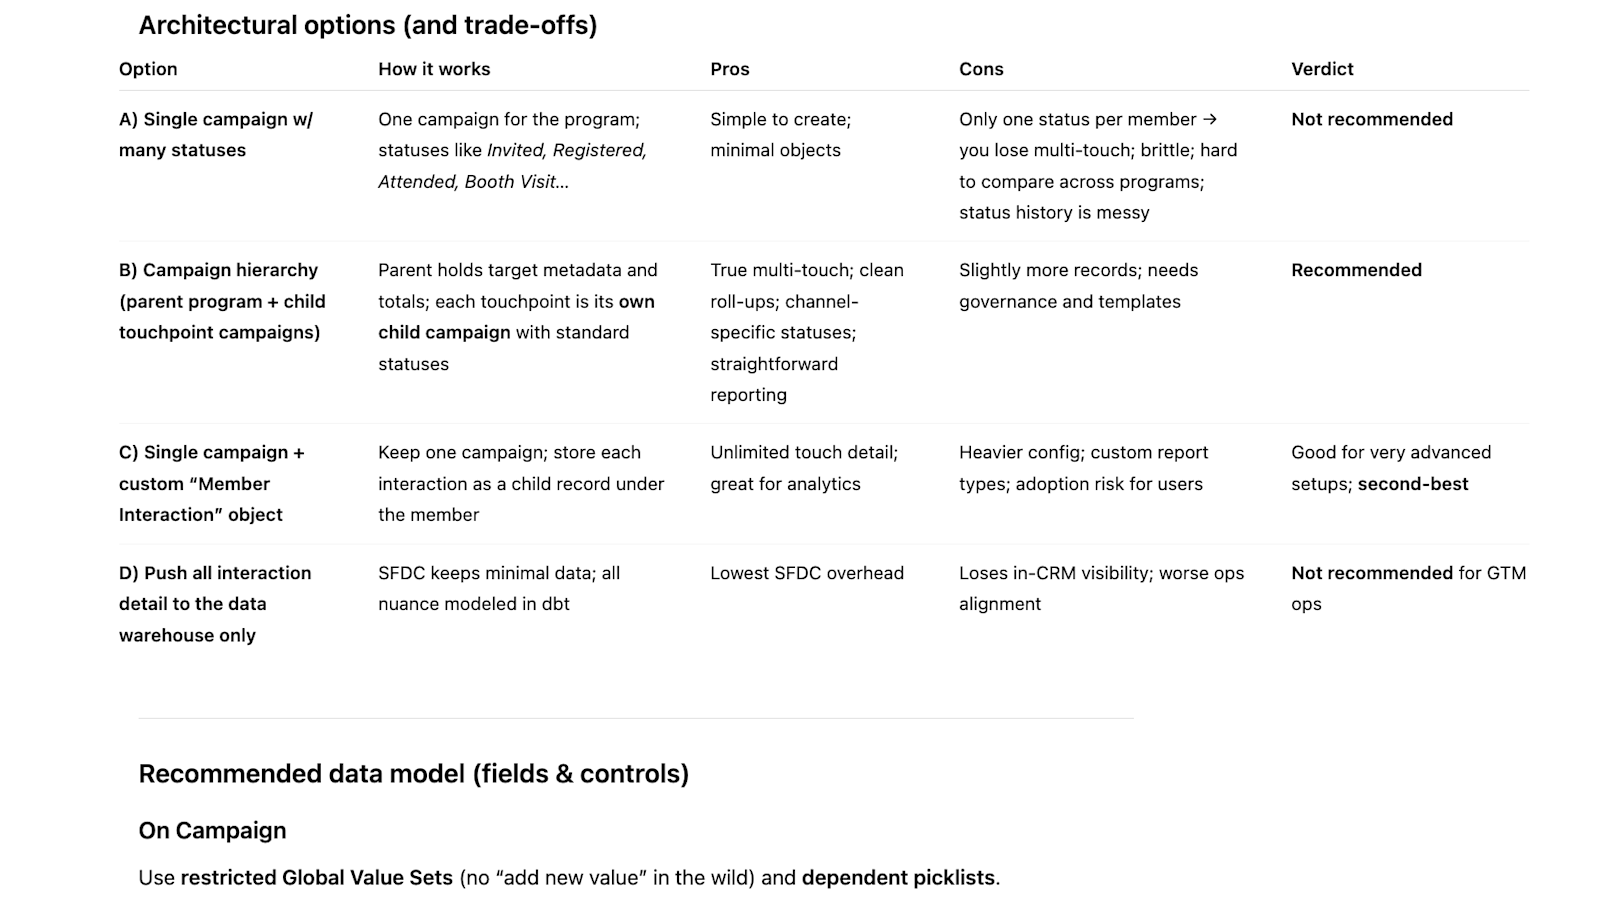
ChatGPT discussing different ways to capture campaign metadata
Using AI to structure and document dbt projects #
When you’re kicking off a dbt project, you usually start with an idea of what your final data is supposed to look like. Then, you work backwards and decide how you’re going to structure the series of joins and transformations that will get you there.
There are plenty of ways to do this that lead to the same outcome, but they are not all created equal; some of them will make it easier to understand and debug the pipeline, or re-use certain components for other intermediate and mart models.
Going through all of the possible permutations and their pros and cons can take a while, and having a thought partner makes it infinitely easier. AI can help you think through:
How to split things up into staging, intermediate, and mart models
Where it makes sense to leverage seeds or macros
How to materialize the different models (e.g. view vs. table vs. materialized view)
What to model in dbt, or in the semantic layer of your BI tool
Instead of asking the AI to develop a proposal from scratch, I typically approach this by writing a rough draft SQL query that establishes the desired output format as well as key fields and joins, and then working with AI to split it up into dbt models, seeds, and macros:
I have the following SQL code that I want to translate into dbt models.
Please review it and then suggest how to split it up into staging, intermediate and mart models, as well as seeds or macros where it makes sense. Please provide detailed reasoning for your recommendations, and alternative approaches where there are multiple reasonable ways to implement something.
Provide 1) an overview of the proposed dbt project structure as well as 2) the code and a naming suggestion for each proposed model.
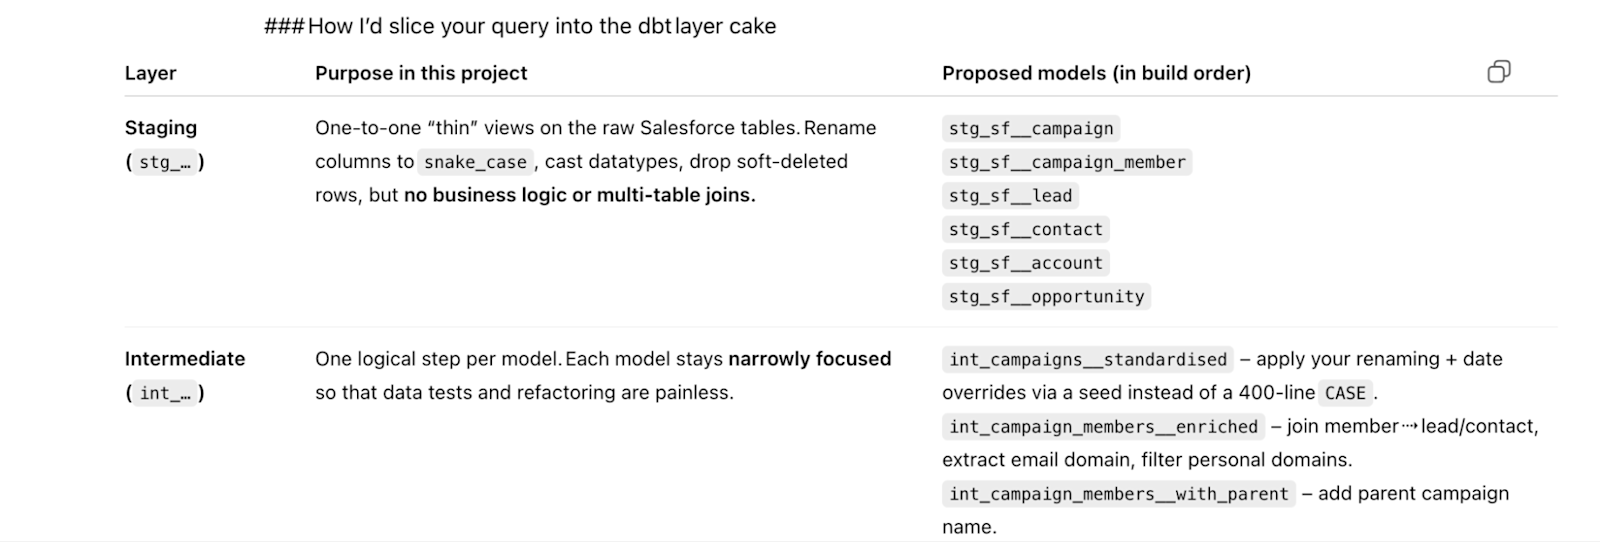
One common pain point here is that if you’re not starting with a blank slate, the proposed models you’ll get back often don’t fit neatly into your existing project. This is where dbt’s MCP server comes in handy: By giving the AI full visibility into everything that’s already in place, you’ll get a much more customized proposal, without having to type up any more manual context.
A few things to keep in mind:
Note that I said “help you think through”, not “tell you”; I recommend using AI as a sounding board and brainstorming partner, not to outsource the ultimate judgment of what should be implemented. At least for now, I always recommend having a human in the loop
Understanding best practices is important, but there are lots of reasons why you sometimes want to deviate from the “ideal” textbook way of doing something (especially in a startup). LLMs tend to be pretty dogmatic with regards to dbt, so I recommend you treat the proposals with a grain of salt and decide where you want to cut corners
Finally, Future You will thank you if you properly document any new models you create. Otherwise, it’ll get harder and harder to properly leverage them downstream, whether by humans or AI.

AI has massively reduced the time this takes, so what used to be a major pain point for most data teams should now just be a no-brainer final step of the development workflow:
“Every time we're going to deploy, we run the table through dbt Copilot to get a high-level summary and documentation, which automatically gets ingested by Omni’s AI. If we need to tweak or add to the metadata, it’s quick. We’re able to get reliable AI responses without requiring tons of effort from my team.” – Austin Aranda, Director of Data Solutions at SWBC
Using AI to optimize SQL code #
If you paid close attention to the example screenshot above, you might have seen that ChatGPT took a jab at my SQL code (“400-line case statement”). While it’s a slight exaggeration, there is a kernel of truth to it: When I write a SQL query, I first write it in the most straightforward, brute-force way imaginable, even if it’s inefficient computationally or results in way too many lines of code.
The reason is simple: I first want to see if it works and produces the right outputs before I spend any time optimizing.
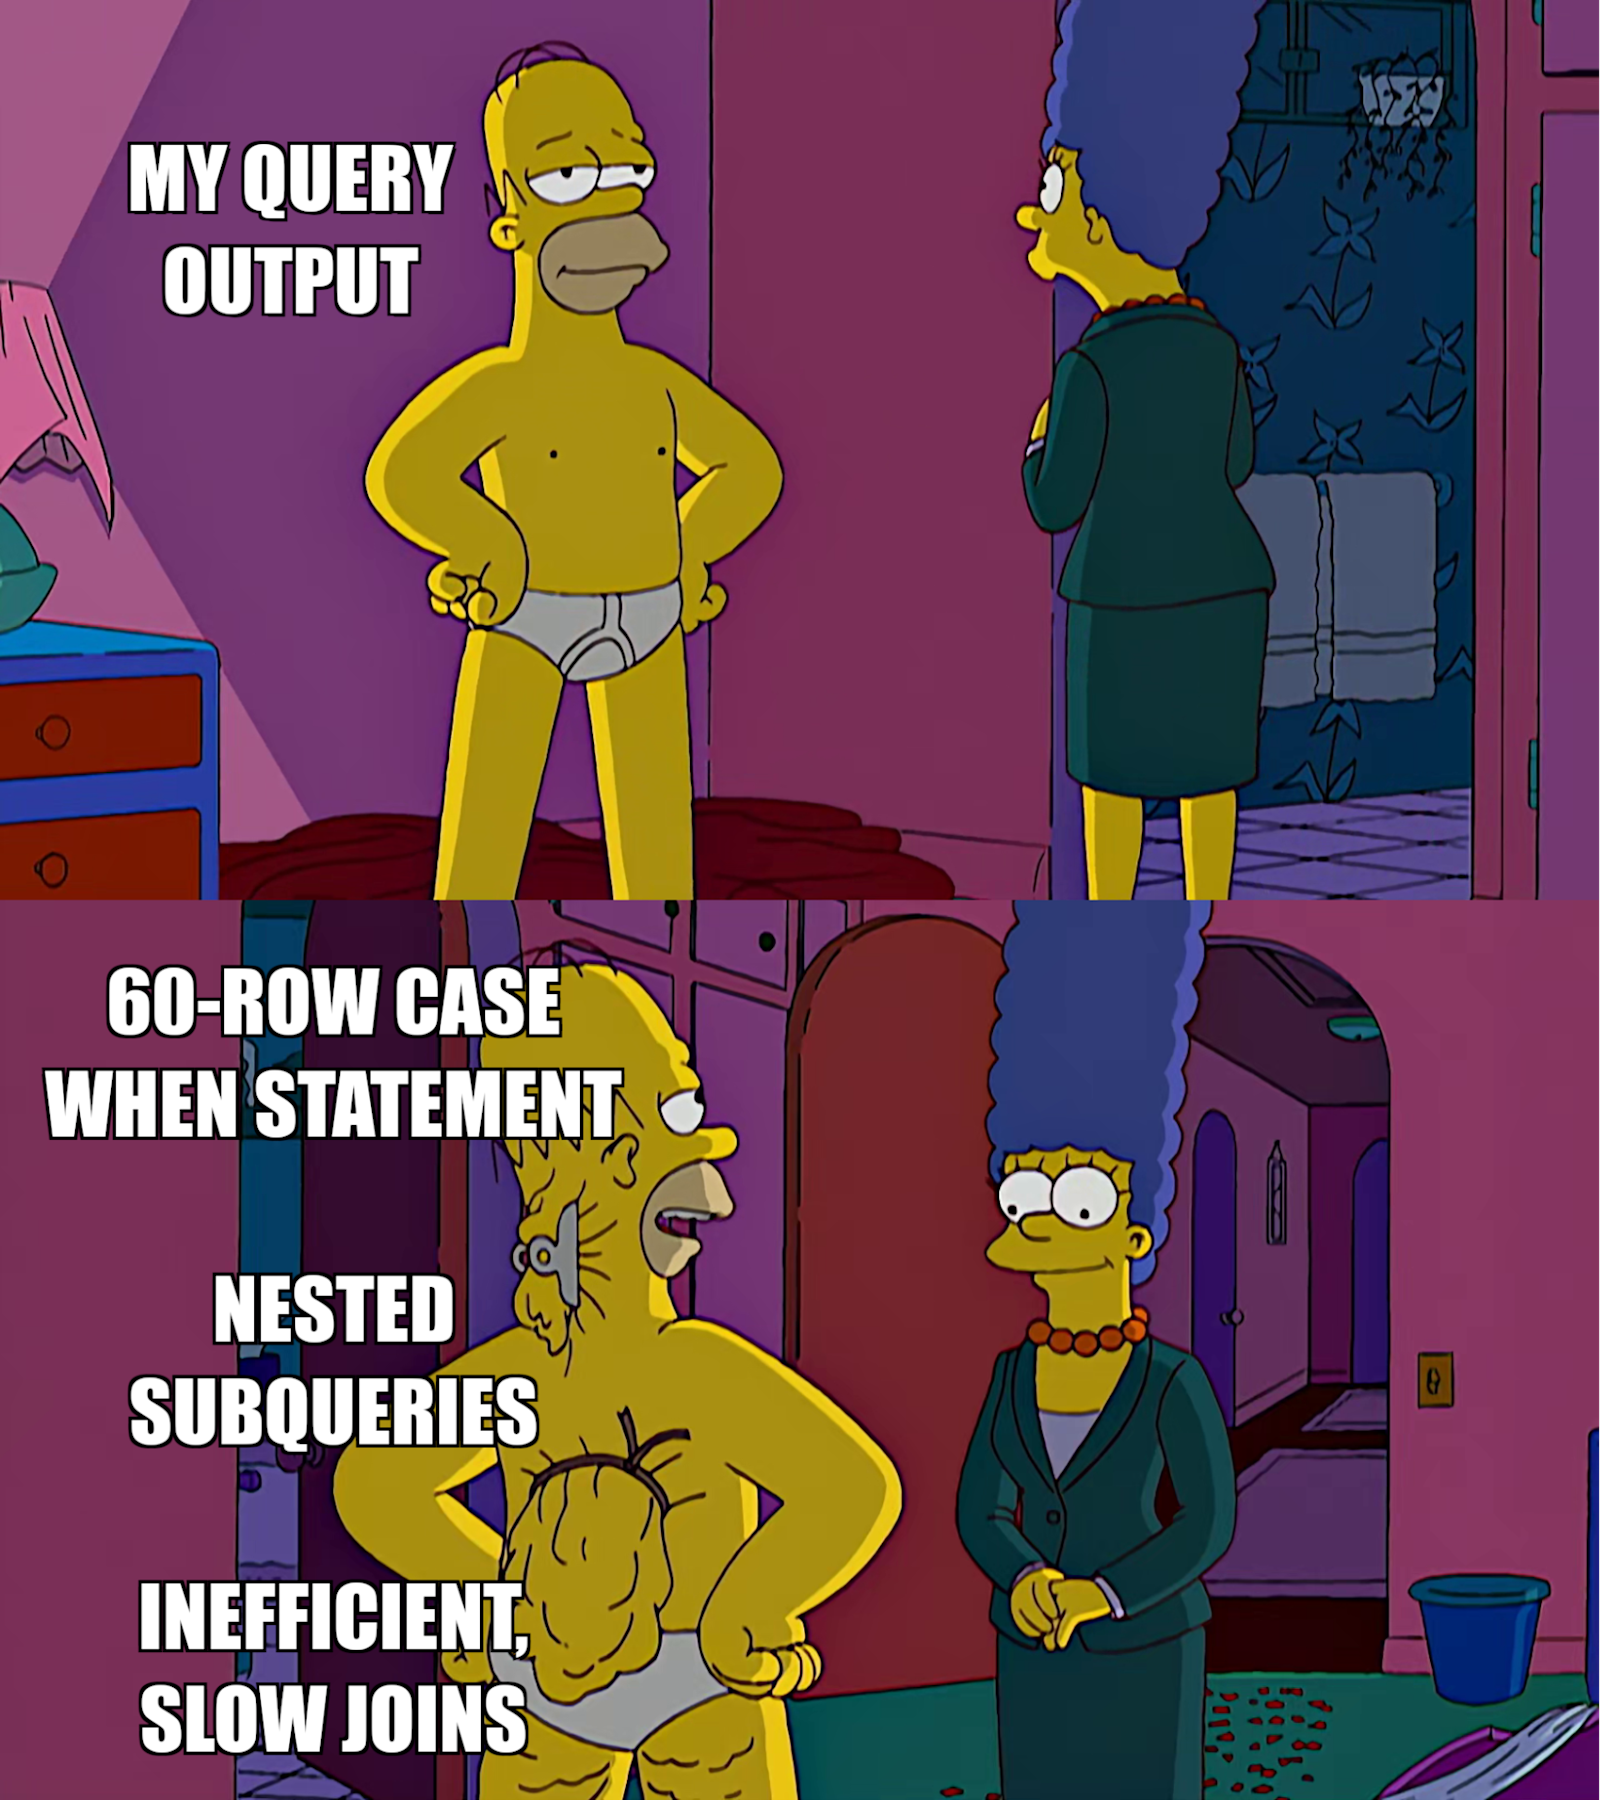
Better fix it in case anybody ever takes a closer look
Then, I go back and refactor the query to be more efficient, handle all edge cases correctly, etc. Doing this can feel rewarding, and it’s good to practice it occasionally to hone your SQL skills, but I often get an itch to move on to the next 0 -> 1 task instead.
So I’ve started turning to AI to help speed things up.
You can either share your query and ask generally for opportunities for improvement, or you can pick specific aspects you want feedback on. For example:
Query structure / joins:
Is there a more efficient way to structure CTEs and joins?
Are you potentially creating duplicates or dropping rows unintentionally?
Edge cases: Are you anticipating and handling all possible edge cases in the data you’re processing?
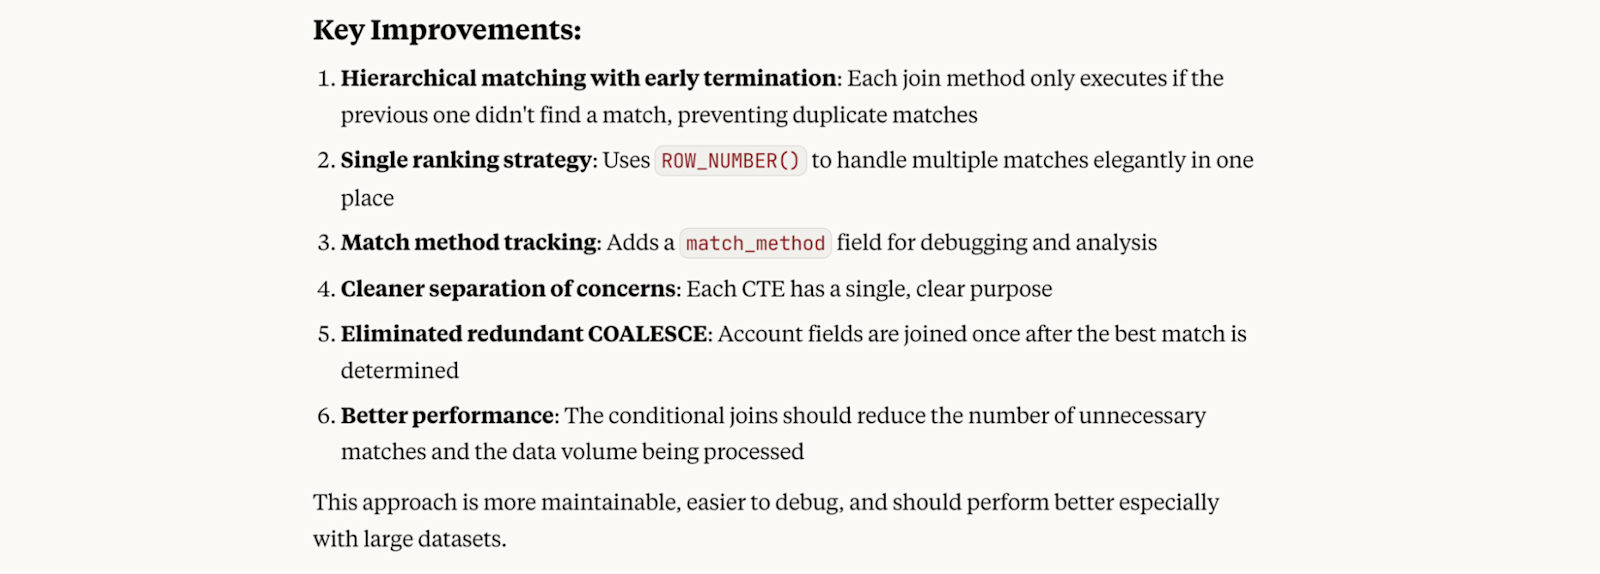
A query review example from Claude
If you’re using an AI-assisted IDE like Cursor, you can get that feedback without switching tools. Otherwise, copy-pasting code into one of the major chatbots also works pretty well and only adds minimal friction.
“Whenever I write code, I always use AI to debug because it makes it so much quicker. For example, something that I really like about Cursor is that when anyone raises a PR, it does the first code review. We’re a small team and we work really fast, and it’s really helpful.” – Edward Mancey, GtM & Ops Data Lead at Synthesia
Using AI to create custom visualizations #
Most BI tools offer a wide range of common visualization types out of the box. But sooner or later, there will be a use case that will motivate you to create a custom visualization beyond what’s readily available.
I ran into this when I wanted to create a visual timeline of how prospects and customers interact with us at conferences or events we host: Who registered, who showed up, who stopped by our booth etc.
😊 The good news: Omni lets you create any visualization you want using VegaLite
🥺 The bad news: I had never used VegaLite before and was unfamiliar with the syntax; and I didn’t want to spend hours on a simple visualization for a single dashboard
So I turned to AI; since I was creating this visualization for an internal report, there was limited risk of breaking anything important, and speed was more important than writing the most elegant code.
Within a few minutes, I had a working prototype. And after 10 more minutes of formatting tweaks, it looked pretty neat:
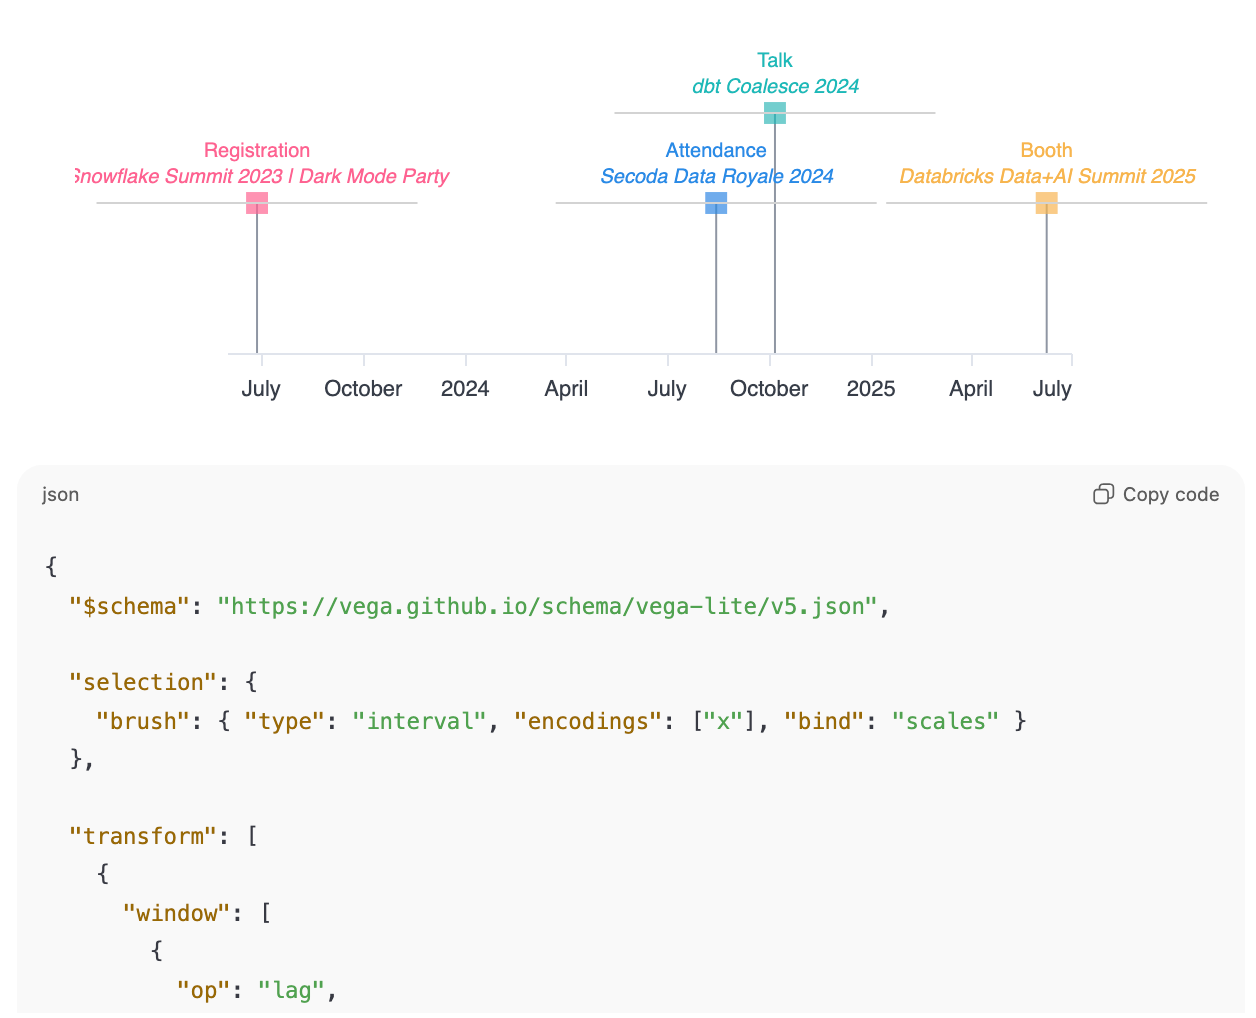
And the best part: All it took was a brief natural language conversation instead of writing 100+ lines of code by hand.
3. Leveraging AI to scope complex analytics projects #
Using AI to write specs and project plans #
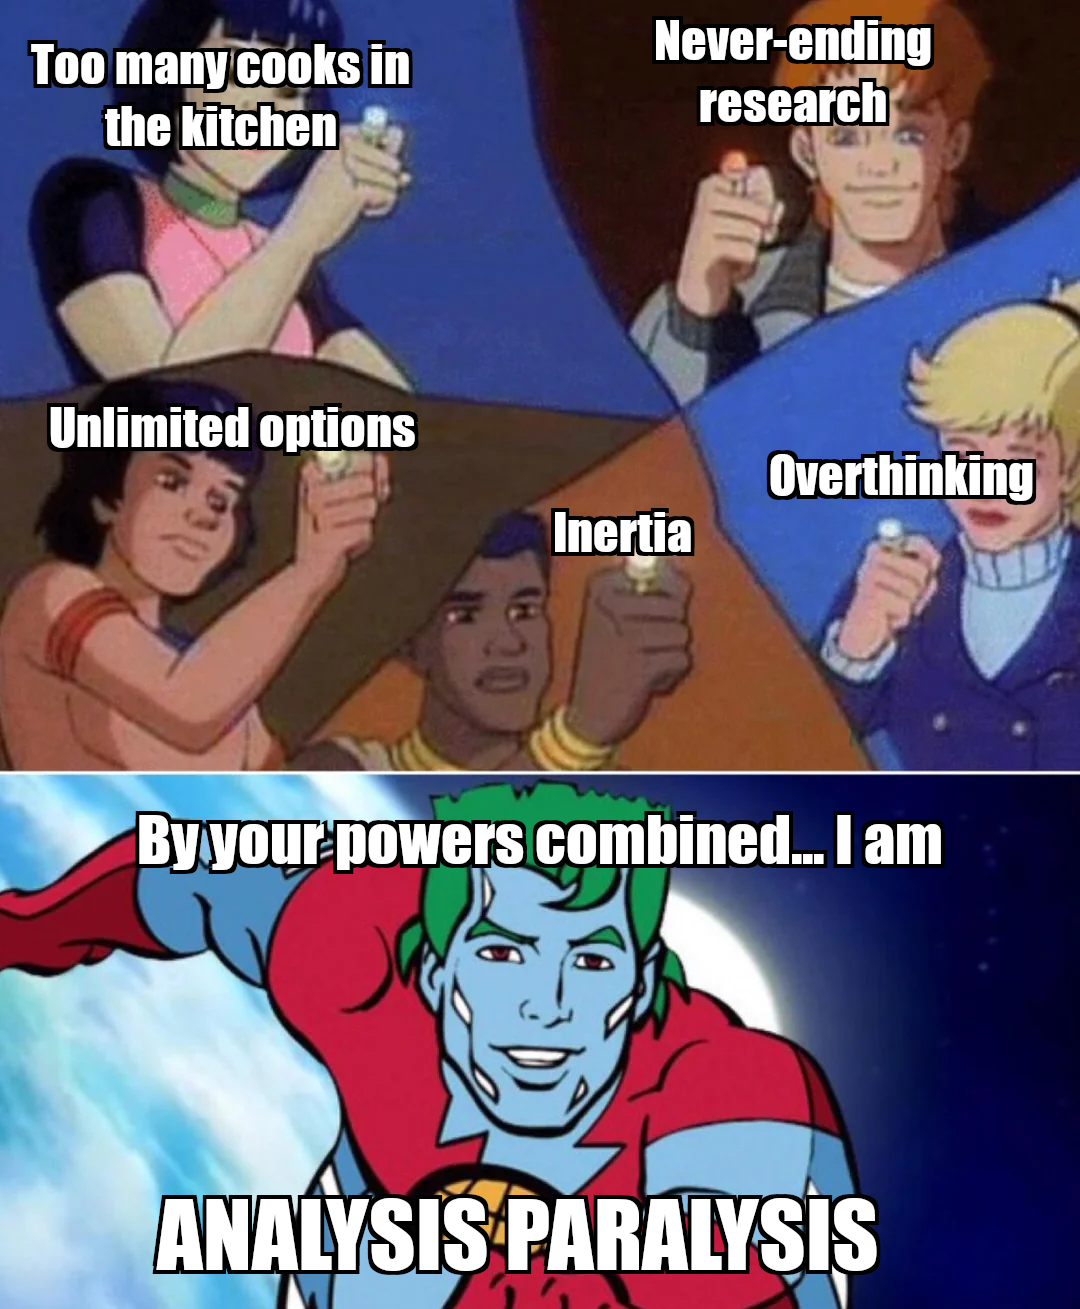
Many projects fail before they even start.
There are many reasons for this, but one common one I’ve seen over and over is that the scope of complex 0 -> 1 projects is so overwhelming that the team spends weeks (or even months) in analysis paralysis and never actually develops any momentum.
For example, let’s say the marketing and sales teams asked you to develop an account score. Where do you even start?
Should you buy software or build this in-house? If you buy, which vendor is the best?
If you build it in-house, what type of model do you need? What should the output look like? What features are relevant? How do you operationalize it once it’s built?
Individually, none of these questions are particularly difficult, but together they can seem insurmountable.
AI, specifically Deep Research, can make this initial phase much easier. I recommend a two-step approach:
Ask a reasoning model to help you think through everything that’s relevant at a high level
Use the information from step 1 to generate a prompt for Deep Research
This will get you an in-depth, step-by-step guide for the topic of your choice. I don’t recommend completely outsourcing the key decisions to AI (e.g. build vs. buy, or the exact approach you’re taking), but it’s much easier to iterate on a concrete proposal than to start from scratch with the input of a dozen stakeholders.
Step 1: Using a reasoning model to brainstorm key considerations
There’s no need to overengineer the prompt here. Something simple like this will get you a good overview of the key considerations:
I am planning to build an account score, and I plan to use Deep Research to generate a detailed guide. How can I make sure I get a customized, actionable result? Please touch on
1) things I need to decide before I proceed 2) context I need to provide to get a customized output, and 3) sections I should ask for in the report (these should cover all important aspects of building and operationalizing an account score).
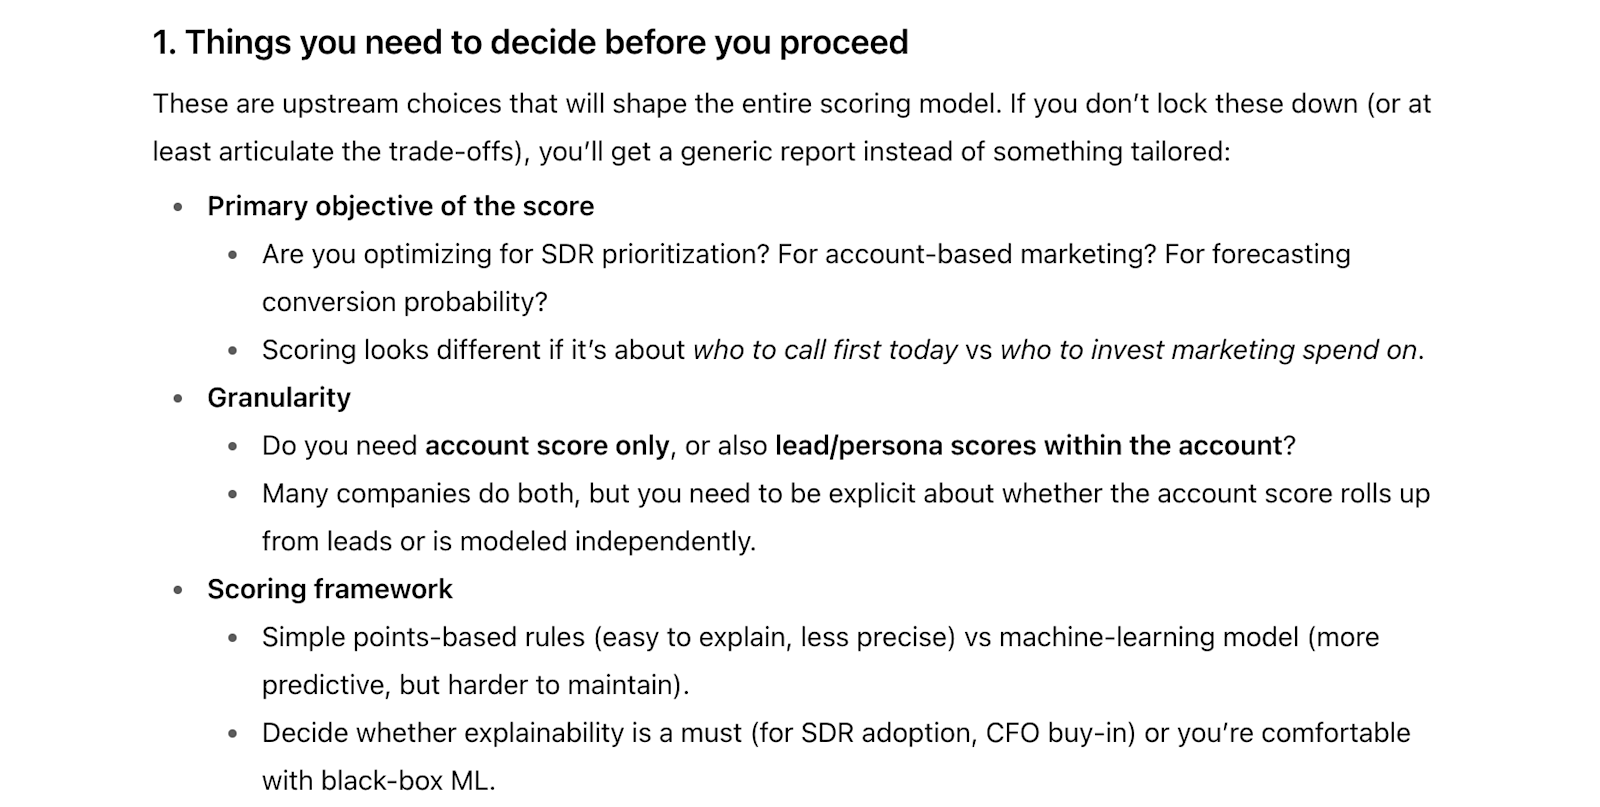
Full answer here
That’s a pretty solid starting point, I’d say. You don’t have to answer all of the questions the AI raises before you proceed, but you’ll get a much more useful playbook if you at least get clarity on a few central ones (like what your ultimate objective / use case is).
Step 2: Generating a Deep Research report
Assuming you have clarity on your goal, the type of output you want etc., it’s time to generate the detailed guide. I recommend picking the most helpful suggestions from the AI and complementing them with your own thoughts.
💡Note: You can also ask AI to generate the prompt (in fact, GPT-5 proactively offered this), but I recommend writing it yourself. AI-generated prompts often contain a lot of stuff you don’t actually need, and that will dilute the report.
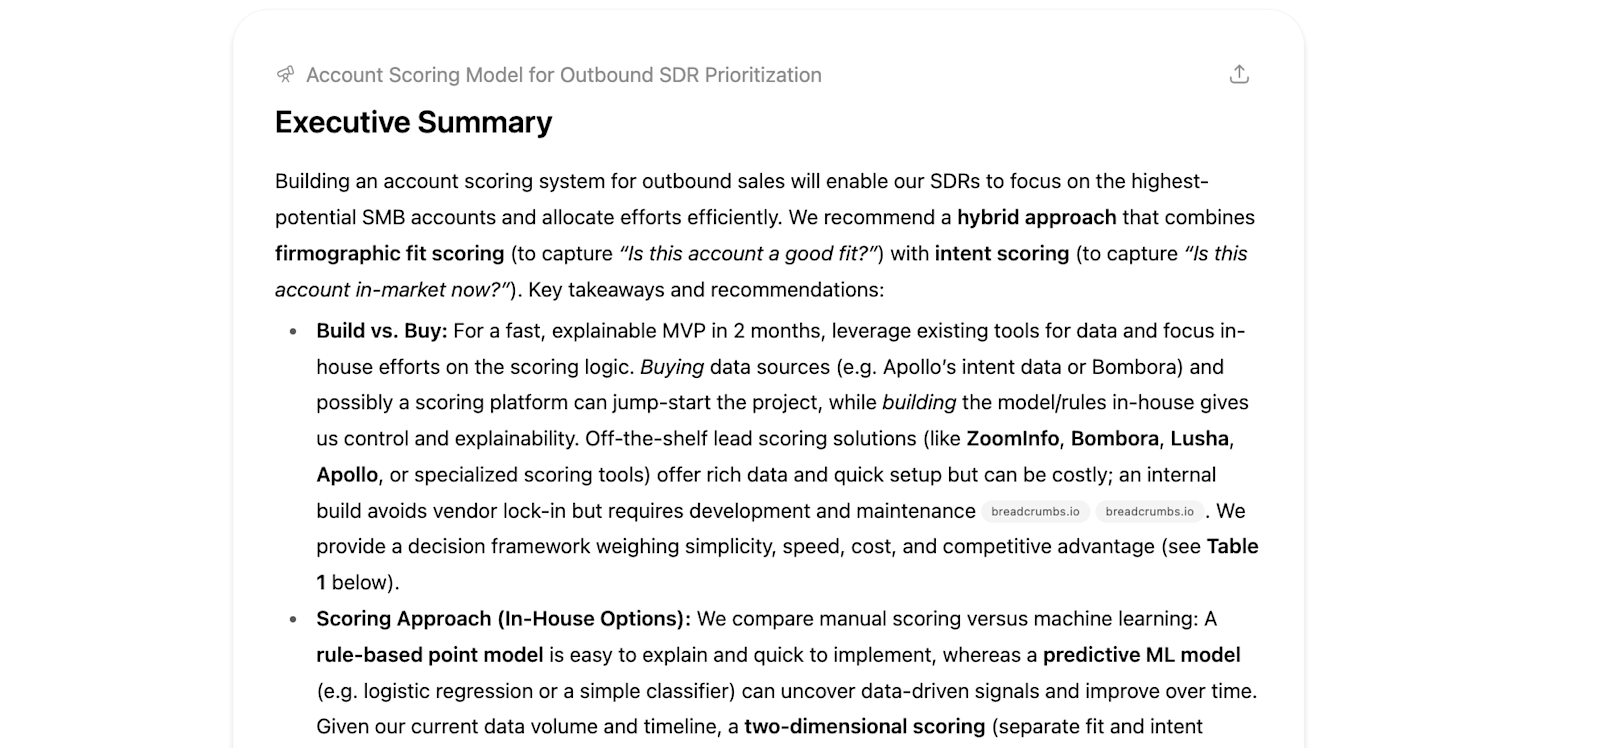
For the account scoring example from above, an effective Deep Research prompt looks like this:
<goal> We want to build an account score to [your goal (e.g. account allocation to SDRs + prioritization]. The score should [any requirements w.r.t. the output, e.g. separate firmographic fit and intent scores, or a high degree of explainability] </goal>
<context> [Add context regarding your company; e.g. your industry, product, business model, ICP, marketing & sales motions, marketing & data stack, envisioned timeline & deadlines, budget, etc.] </context>
<structure> Provide an overview of the key decisions that need to be made and the major work streams. For each body of work, provide an overview of different relevant approaches we could choose from, and then provide a detailed step-by-step guide for your recommended one </structure>
<content> Please cover, at a minimum, the following topics:
Build vs. buy, including a detailed comparison of available product solutions A comparison of various approaches to building this in-house (e.g. across criteria like effort to build and maintain, explainability, sophistication etc.) An overview of the key firmographic characteristics and intent data points we should use, and the best tools / vendors to source this data from How we backtest and evaluate accuracy How we operationalize the score Which team should own this during 1) development and 2) on an ongoing basis </content>
<instructions> Whenever there are multiple valid approaches, please compare their pros and cons and give a decision framework rather than a simple recommendation, so we can work through what works best for us. Support any claim you make with in-text citations. If you need additional context, please ask for it </instructions>
(If you don’t want to type up all of this context, you can also simply upload relevant documents, to the degree your organization’s AI policies allow this.)
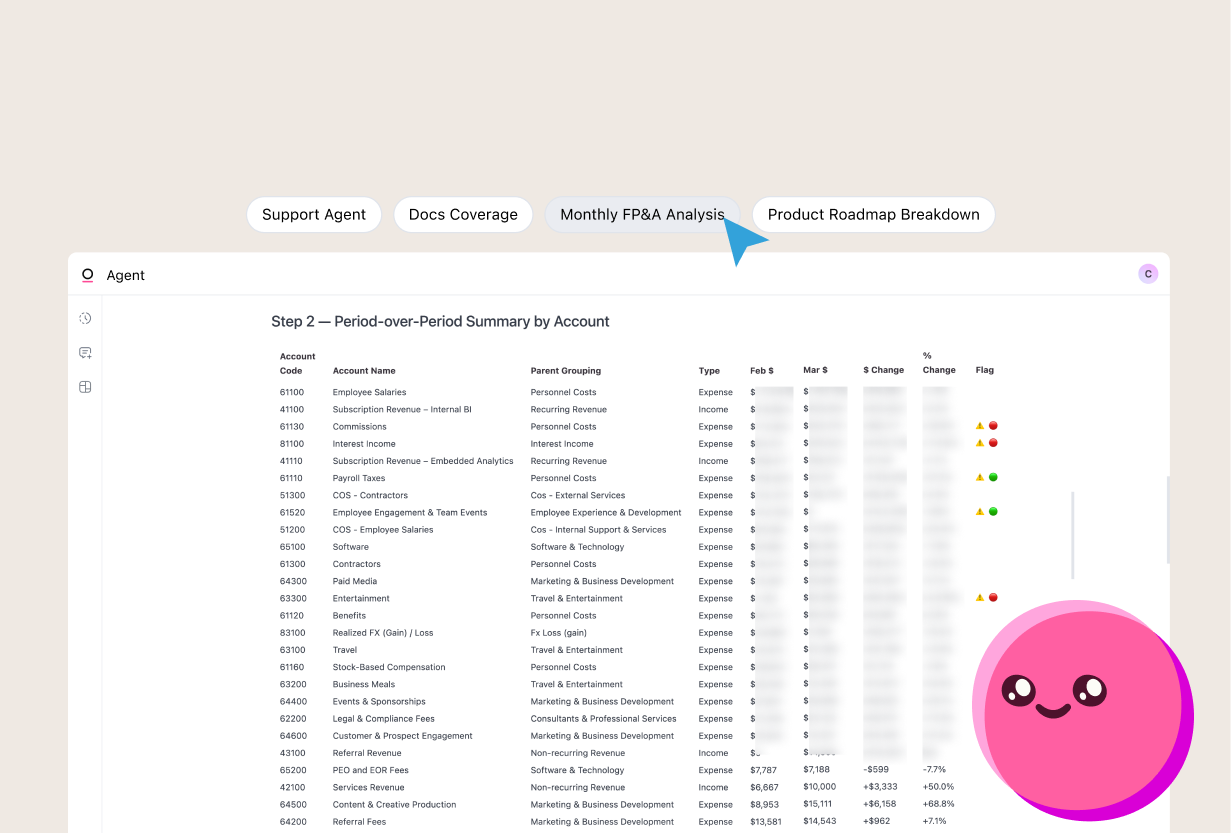
Based on this, after 10 - 20 minutes, you get back an extremely detailed guide (in this case, over 14,000 words):
Full answer here
Even if the report you get back looks solid at first glance, I recommend treating it as a first draft instead of a final deliverable. Ask follow-up questions and push back on anything that doesn’t make sense to you. For example, one key weakness in the report above is that it relies heavily on a few sources, so you could ask for a more balanced assessment and/or specify which sources to use.
Then, once you’re happy with the general approach, you can ask for additional implementation guidance. Sticking with the account scoring example from above, that could be:
An exhaustive list of features to consider
An overview of the proposed architecture of the model
Code snippets in the language of your choice to start building a prototype
Also: If you have strong opinions on how you want to do things and don’t feel comfortable leaning on AI this heavily, there is still value in using AI as a thought partner.
Instead of asking for a guide, you share your plan and then ask for feedback:
Did you miss anything important?
Are there any edge cases or downstream consequences you’re not thinking of?
Is there a way to simplify or speed things up?
Using AI to create mock-ups and ensure you�’re building the right thing #
There’s nothing more frustrating than spending weeks on a project only to realize you built the wrong thing and nobody is using it.
At that point, it doesn’t matter who is “at fault”; whether business stakeholders didn’t communicate their needs clearly, or the data team didn’t describe the envisioned solution in an intuitive way, the work went to waste and you have to start over.
By far, the easiest way to prevent this from happening is to create a mock-up of what you plan to build before you write any code. That way, you can spot – and clear up – any disconnect immediately. Before AI, that meant spending hours in Google Sheets or Figma; but now, you can create a mock-up with a series of targeted prompts.
I generally recommend starting with a static UI, for two reasons:
A static UI mock-up is much easier to build and is often enough to get the feedback you need
And if it isn’t, you can turn it into an interactive prototype; and that prototype will turn out much better with this reference as opposed to starting from scratch
Let’s say we want to build an internal tool that visualizes experiment results for business teams. Our key idea is that instead of just displaying a list of metrics like in most tools, we want to display them in a driver tree whenever they’re interconnected.
Before we actually build a production-ready version of this, though, we want to make sure users find it as intuitive in practice as we think it will be.
There are a few different ways we can go about the mockup(s):
Option 1: Start with a hand-drawn sketch
If you have a pretty clear image in mind of what you want, it’s often fastest to just put pen to paper and sketch it out. Or, if you’re not artistically inclined, spend a few minutes in Google Slides or a similar tool creating the rough outline.
I have zero (I repeat, zero) drawing skills, but I was able to get something close to what I had in mind with ~1 minute of sketching, a single-line prompt, and another minute of wait time while Claude turned my terrible mess of a sketch into an HTML-based mock-up:
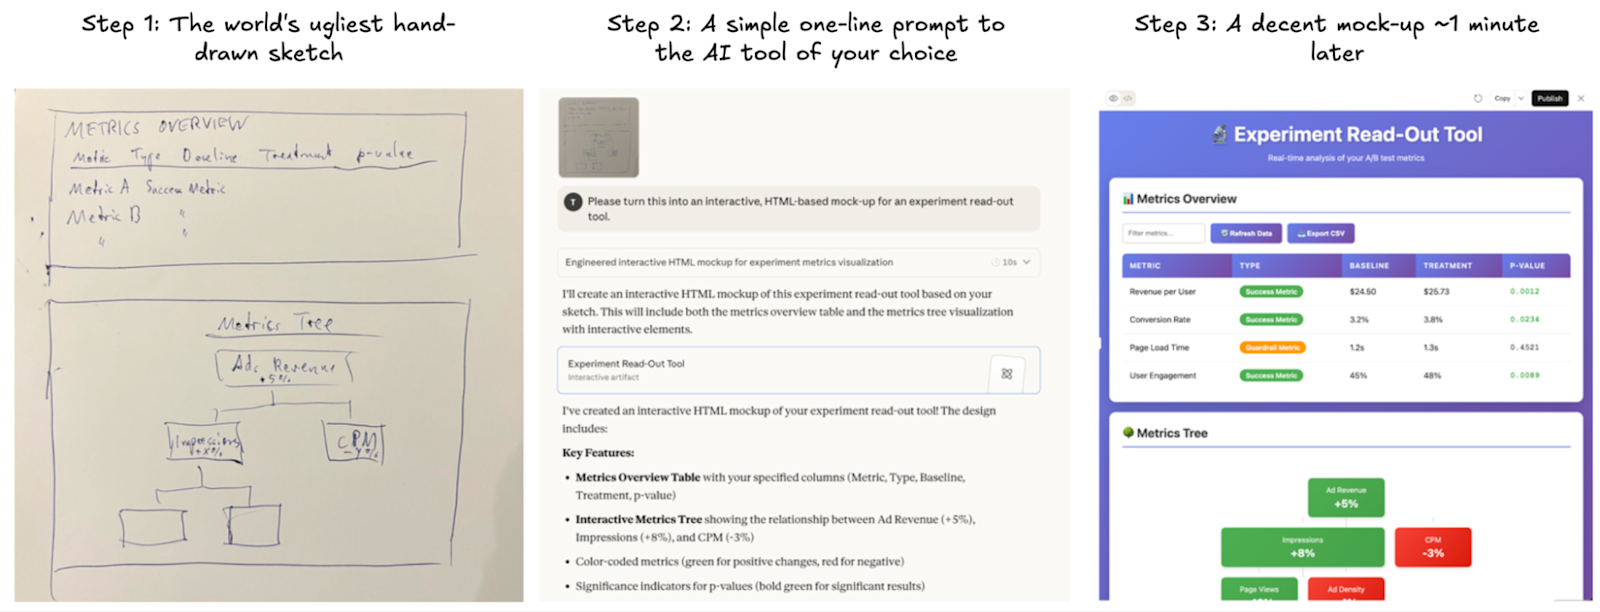
Instead of laughing at me for my lack of drawing skills, Claude just whipped up a neat mock-up
Option 2: Describe in detail what you want and iterate your way towards a mock-up
Alternatively, if you don’t feel like drawing, you can also just briefly describe what you want. This is what I got from Claude with a ~150 word prompt and a bit of feedback on the initial output:
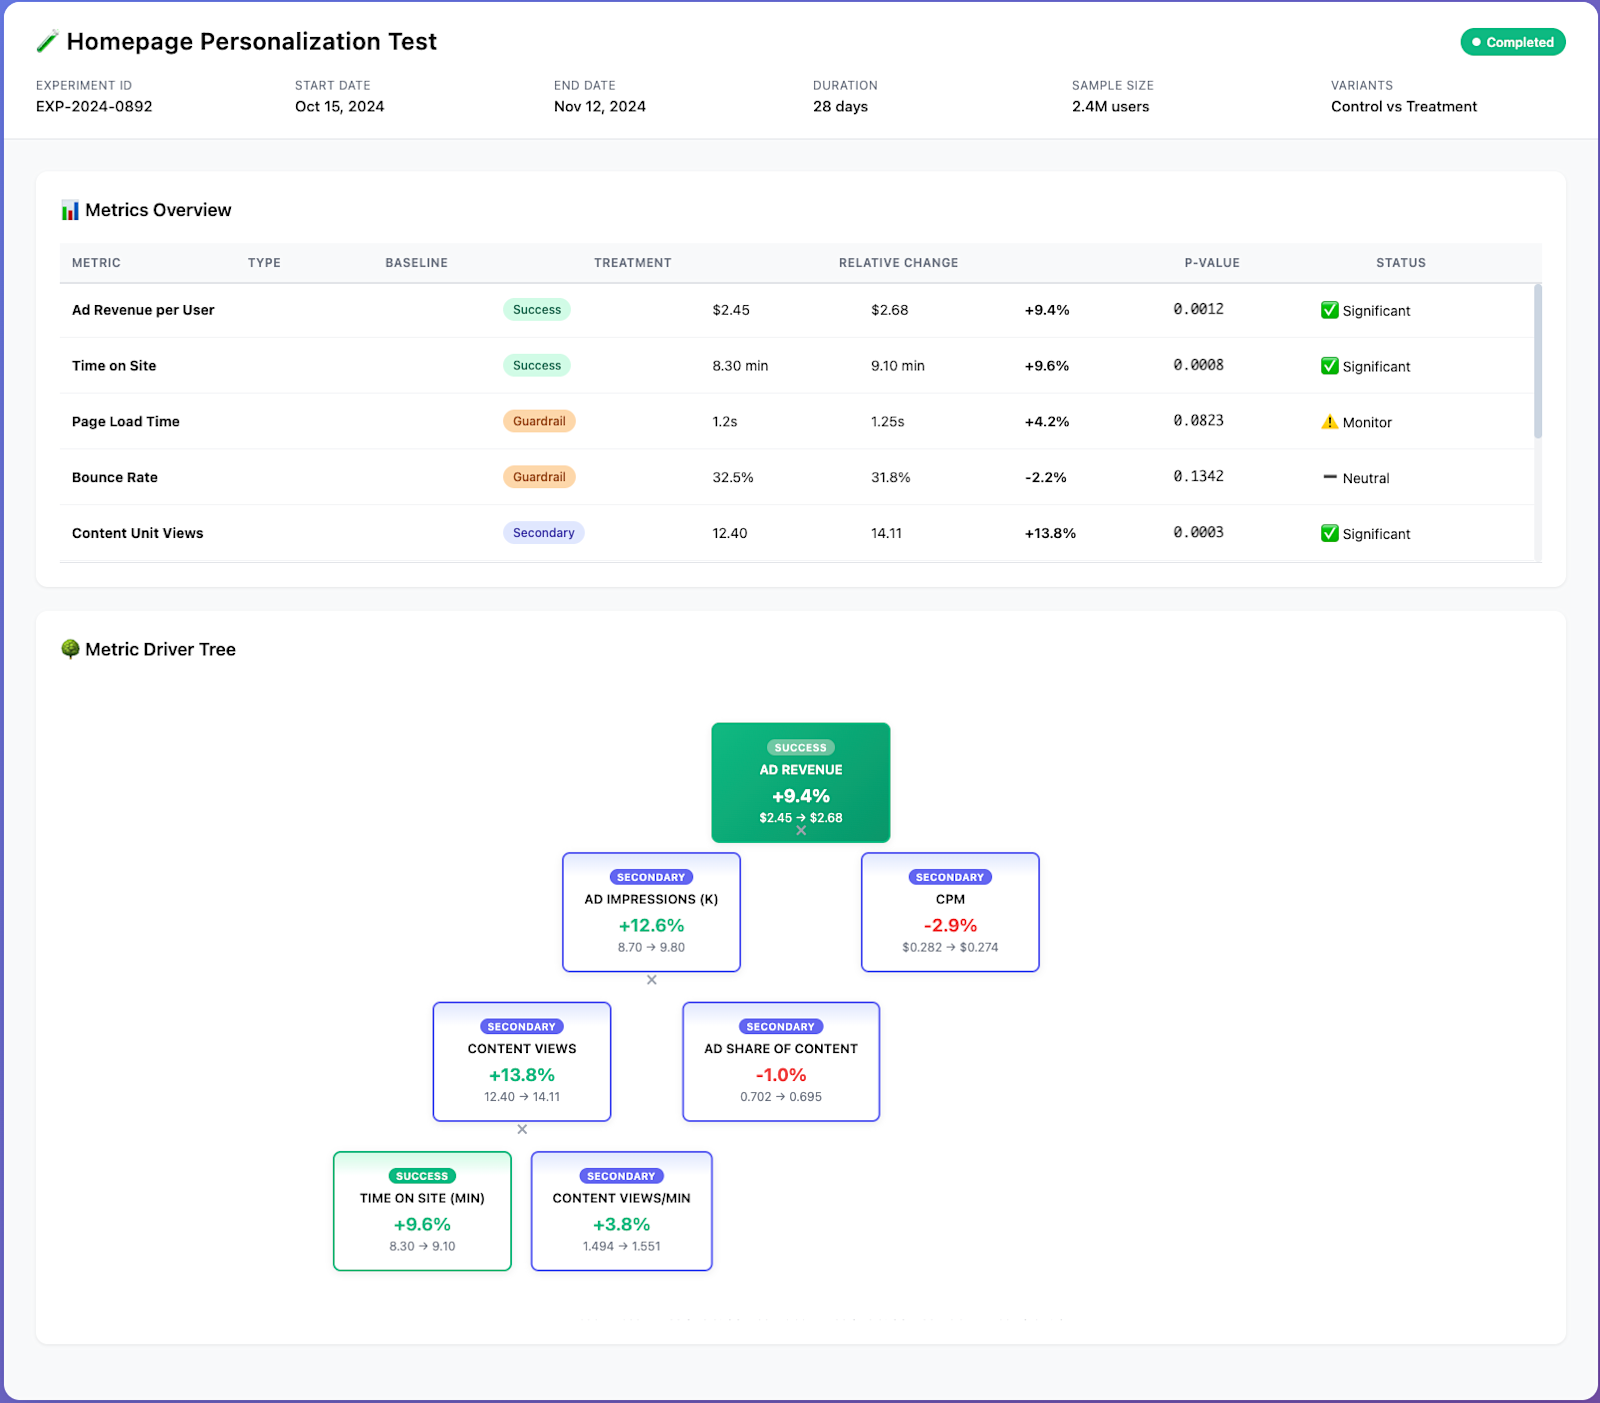
There are a few remaining formatting issues etc., but still; a mock-up now takes minutes, not hours
It’s HTML-based and already comes with some basic interactivity; for example, you can scroll through the metrics table.
At this point, you could either keep providing feedback and ask the AI to add more features (e.g. tooltips when you hover over certain parts of the dashboard), or you can switch to a proper vibe-coding / prototyping tool like Lovable or Vercel V0 and ask it to turn this mock-up into a fully-functioning prototype app.
Alternatively, if we have multiple possible layouts in mind and are trying to decide, we can also mock up a few variants and then ask stakeholders which one they prefer.

Then, once you get feedback from stakeholders and finalize your spec, you can either improve your prototype until it’s production-ready, or you can rebuild it in a more robust fashion from scratch.
Either way, you know you’re building the right thing.
Bonus: Incorporating real data into your mock-up using an MCP server
One downside of the approach discussed above is that it will create a mock-up or prototype full of “fake” data; while this isn’t a huge issue, it will make the result feel less real to stakeholders.
If you want to go the extra mile and show them what the dashboard or tool you plan to build will actually look like in production, you can use an MCP server to give the AI access to your data. When your mock-up shows the actual list of experiments you ran last month, or top accounts by revenue, or familiar month-over-month growth rates, it’s much easier to get people comfortable with it.
4. Using AI to level up written and verbal presentations #
Improving delivery of data-based findings & recommendations #
The number one most common reason why I’ve seen dashboards, models, or data tools fail to gain adoption was discussed above: There was misalignment (or miscommunication) with regards to what was truly needed to solve a business problem, so the analytics solution that was built didn’t add value.
The second most common failure mode I’ve observed happens on the opposite end of the process: Even if the problem was well understood, potentially impactful recommendations or solutions don’t get implemented because the data team often struggles to effectively influence business stakeholders and clearly articulate the business value of their work.
Over the years, I’ve spent countless hours working with my teams to make their communication more concise and impactful. Unfortunately, doing this 1:1 as a manager is not particularly scalable.
That’s where AI comes in.
Even with default settings, current generation models from OpenAI or Anthropic can provide robust feedback on presentations or documents. If you want exceptional results, though, you have to provide custom instructions.
You can either share these with members of your team so they can add them to their settings or Projects as desired; or, if you want central control, you can create a custom GPT that’s accessible to everyone on your team.
I recommend using instructions along these lines (you can customize these based on your and your organization’s preferences):
When you’re reviewing presentations, documents etc., please make sure they adhere to the following principles and best practices. Where they don’t, provide detailed, actionable feedback.
- Problems should be structured in a MECE way; i.e. the problem should be decomposed into mutually exclusive and collectively exhaustive components
- Communication should follow the pyramid principle: Starting with the most important insight, recommendation, or takeaway, and then providing supporting arguments and data as necessary
- Details that are not essential to the core understanding, or all stakeholders in the audience, should be moved into the appendix to be referenced as needed; nothing should distract from the core message
- Communication should be tailored to the audience and focus on what’s relevant for them (e.g., what should they focus on or what should they be doing differently?) instead of recapping what was done, how the model or analysis works in detail etc.
- Encourage use of frameworks such as issue trees, 2x2 matrices etc. and visuals such as flow charts to facilitate a joint understanding of complex subject matter
- Make sure slides tell a story; it should be somewhat clear from reading just the slide titles what the key takeaways are (i.e. titles should state the main point of a slide instead of just saying “Overview” etc.)
- Make sure technical jargon gets minimized and replaced with plain English wherever possible
- Simple charts (line chart, bar chart with single Y axis) are preferable over complex ones; it’s better to split things into multiple individual visualizations (or scrap some of them) instead of creating complex charts that take people a few minutes to understand
- Make sure chart commentary actually adds helpful context or insights instead of just restating what’s visible on the chart
With these instructions in place, all you or your team members have to do is share a slide deck or document and a bit of context (what the purpose is, who the audience is etc.), and you’ll get detailed feedback on how to make it more impactful in return.
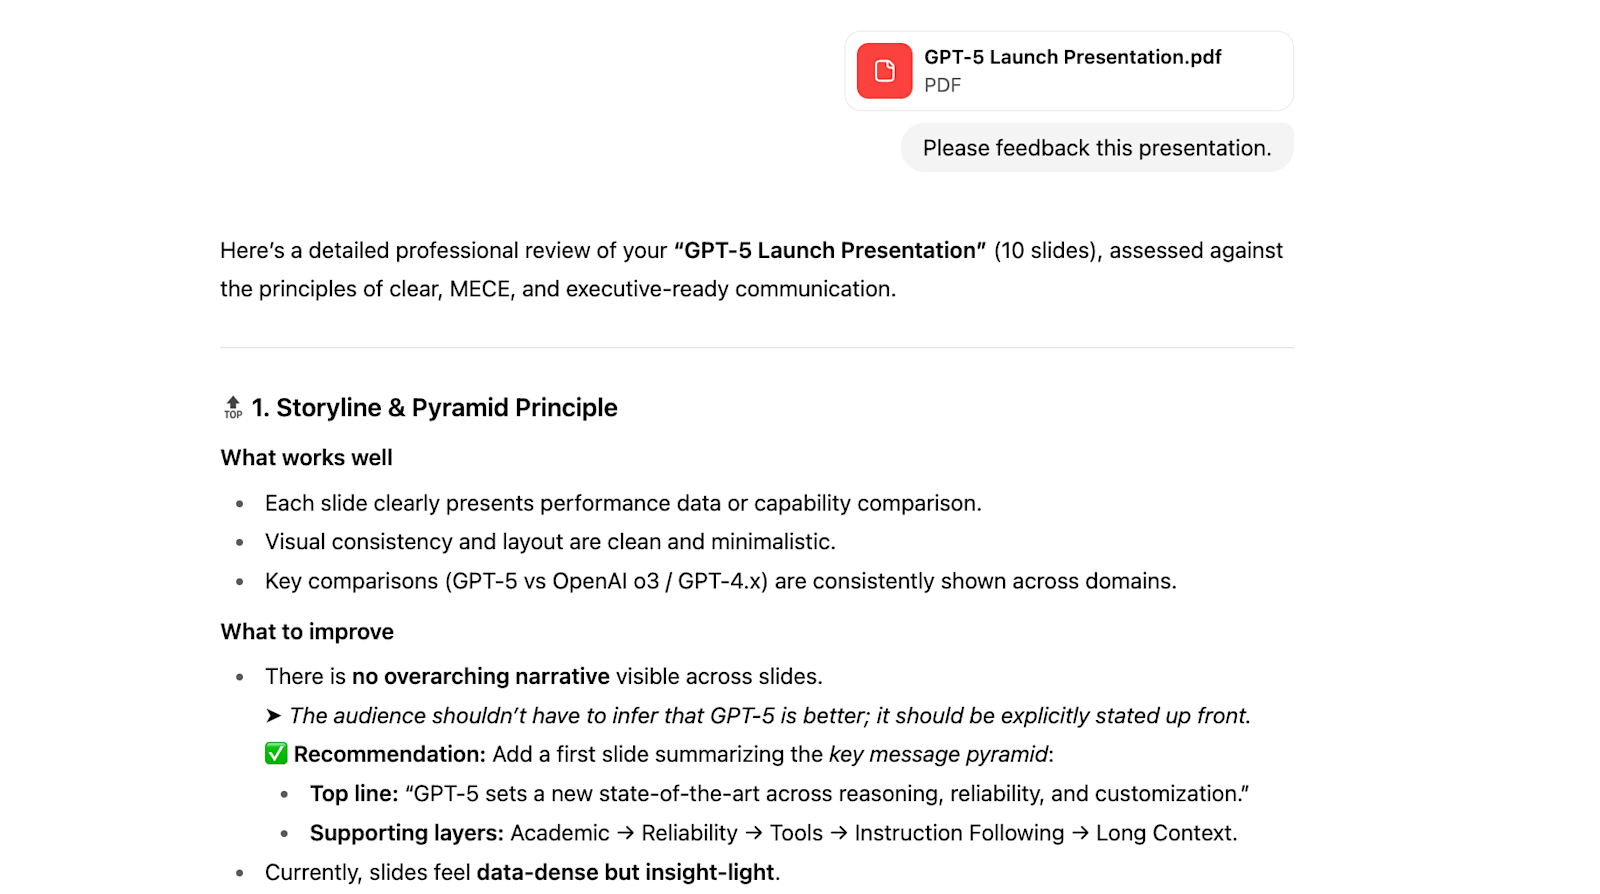
Full review of the GPT-5 launch slides by… GPT-5
If you’re a team lead, you might still want to review important presentations or documents before they go out. However, the GPT can take a first stab at feedbacking your team’s deliverables and save you a lot of time since you’ll review a version that’s already substantially more polished.
Using AI to anticipate stakeholder questions #
Besides making sure written deliverables get to the point and tell a clear story, you can also leverage AI to anticipate questions you’ll likely get from stakeholders.
Nothing is more frustrating than getting a question five minutes into a presentation that derails the entire thing. And if you are not prepared to answer it well, it can destroy trust in the entire analysis (even if it’s fundamentally robust).
An easy way to prevent this is to generate a list of likely questions in advance and prepare answers to them; you can then drop supporting data or arguments in the appendix and pull them up when needed.

You can obviously do this manually, but it can take a while to get an exhaustive list; plus, if you’re deep in an analysis, you often miss obvious questions that others that are less familiar with the topic might ask.
That’s why I recommend brainstorming this with AI as a thought partner. As always, the key is to provide as much context as possible. In this case, that means:
Attaching whatever you plan to present
Listing the most important audience members (e.g. Head of Finance, VP of Sales)
Explaining the purpose of the meeting (e.g. making a particular decision)
I’m meeting with [list of key audience members] to [purpose of meeting].
Please review the attached materials I plan to present and compile a list of likely questions each stakeholder might ask. If you need more context to customize your response (e.g. their current roadmap, goal metrics etc.), please ask for it.
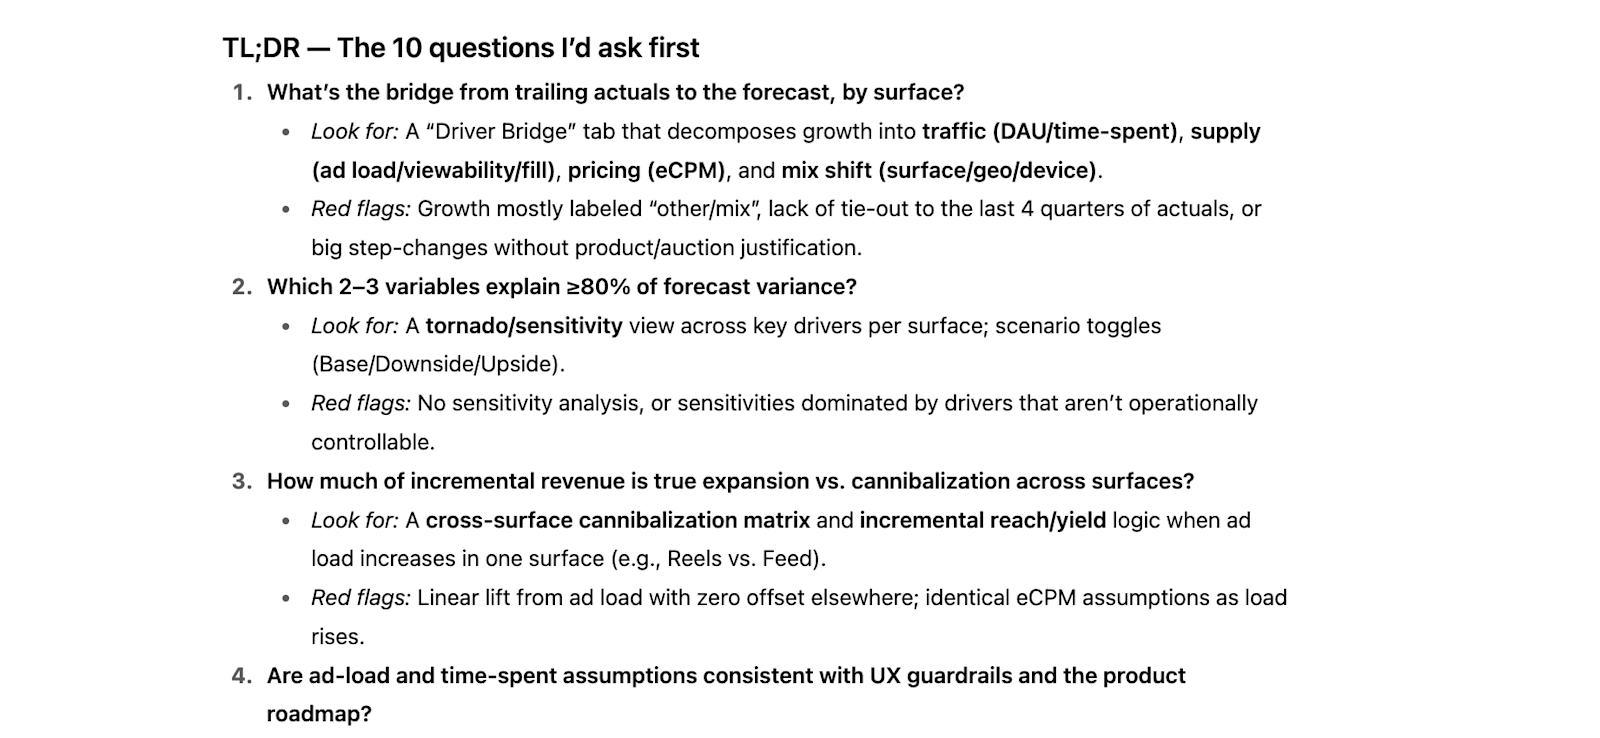
Example: ChatGPT anticipating questions from the Head of Finance re: revenue forecast
As always: The more context you provide, the more customized and helpful the response will be. But even the generic ones AI comes up with are often pretty helpful to prepare.
By the way; you might get some fundamental feedback this way and, as a result, have to re-work your slides or document extensively.
To minimize this risk, you can share the “raw” data you plan to present (e.g. a forecast, experiment read-out etc.) and the context described above, and then ask for 1) a list of likely stakeholder questions and 2) where you should focus your presentation before you start putting it together. Then, after you create your draft, you can ask for a final review to optimize for flow and key takeaways.
5. Using AI to enable business users #
Arguably one of the best aspects of AI is that it’s always available and endlessly patient. That means it can provide a level of support and handholding to business users that data teams would never be able (or want) to offer.
Five people from different teams are asking the same question? No problem.
Someone needs a 200 line query reviewed, right now? Sure, why not.
AI can guide users across the entire process from finding and pulling data to visualizing it and distilling insights. In many cases, you just need to give stakeholders a few examples of frequent use cases that AI can handle well to get them started, and they’ll quickly come up with other ways to use it themselves.
To help with that, here are three concrete ideas to get you (and your business stakeholders) started:
1. Using AI to structure analyses and investigations
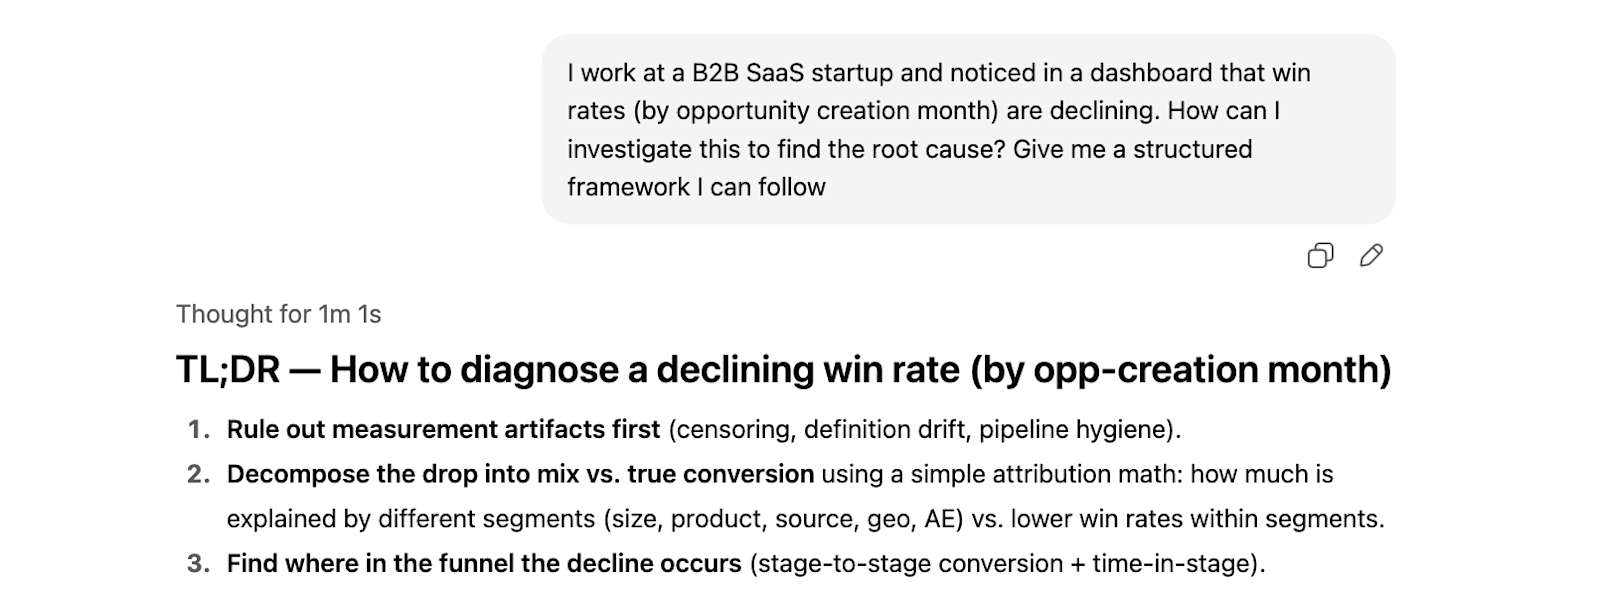
One of the most common analytics use cases for business users is investigating metric movements; for example, rapid spikes or drops, or gradual declines, in metrics the business cares about.
In my experience, these investigations rarely fail due to execution mistakes. Instead, the issue is typically that people don’t know how to approach them so that they systematically and reliably rule out hypotheses and close in on the actual root cause.
Luckily, AI can act as a coach that helps put a structure in place. This can be either through general-purpose AI chatbots, or via AI features in your BI tool. Either way, users can simply share some context on what they’re seeing and ask for advice on how to tackle the investigation:
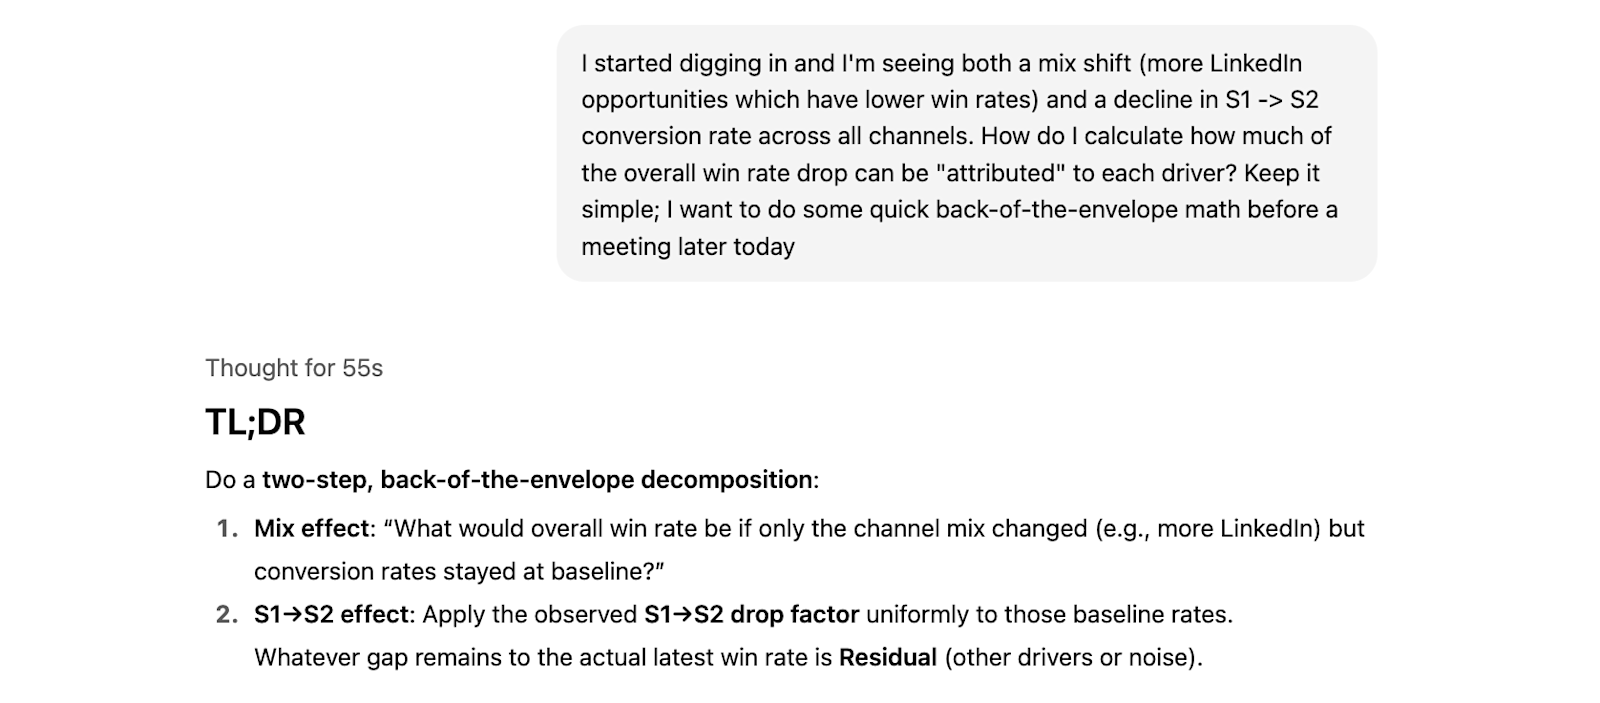
The best part: After getting an initial structure and starting the investigation, users can report on their findings and get updated guidance, iterating their way towards a solution:
2. Using AI to explain data and models
As a data team, a lot of the value is not created by building things, but by explaining how things work and especially what they mean to business stakeholders. For example:
How should they interpret the experiment results they see in the dashboard or experimentation tool?
How can the SHAP values of your ML model help them understand how the model arrived at its predictions?
What’s the right way to think about accuracy, precision, and recall of a model?
LLMs are great at giving these explanations in a way that’s tailored to an audience’s level of technical understanding. Ideally, you integrate an AI assistant into whatever surface business users are consuming this data at; but even just taking screenshots of the relevant data works surprisingly well in most cases (especially if you’re using a custom GPT that has context on your organization and product).
3. Using AI to pressure-test takeaways
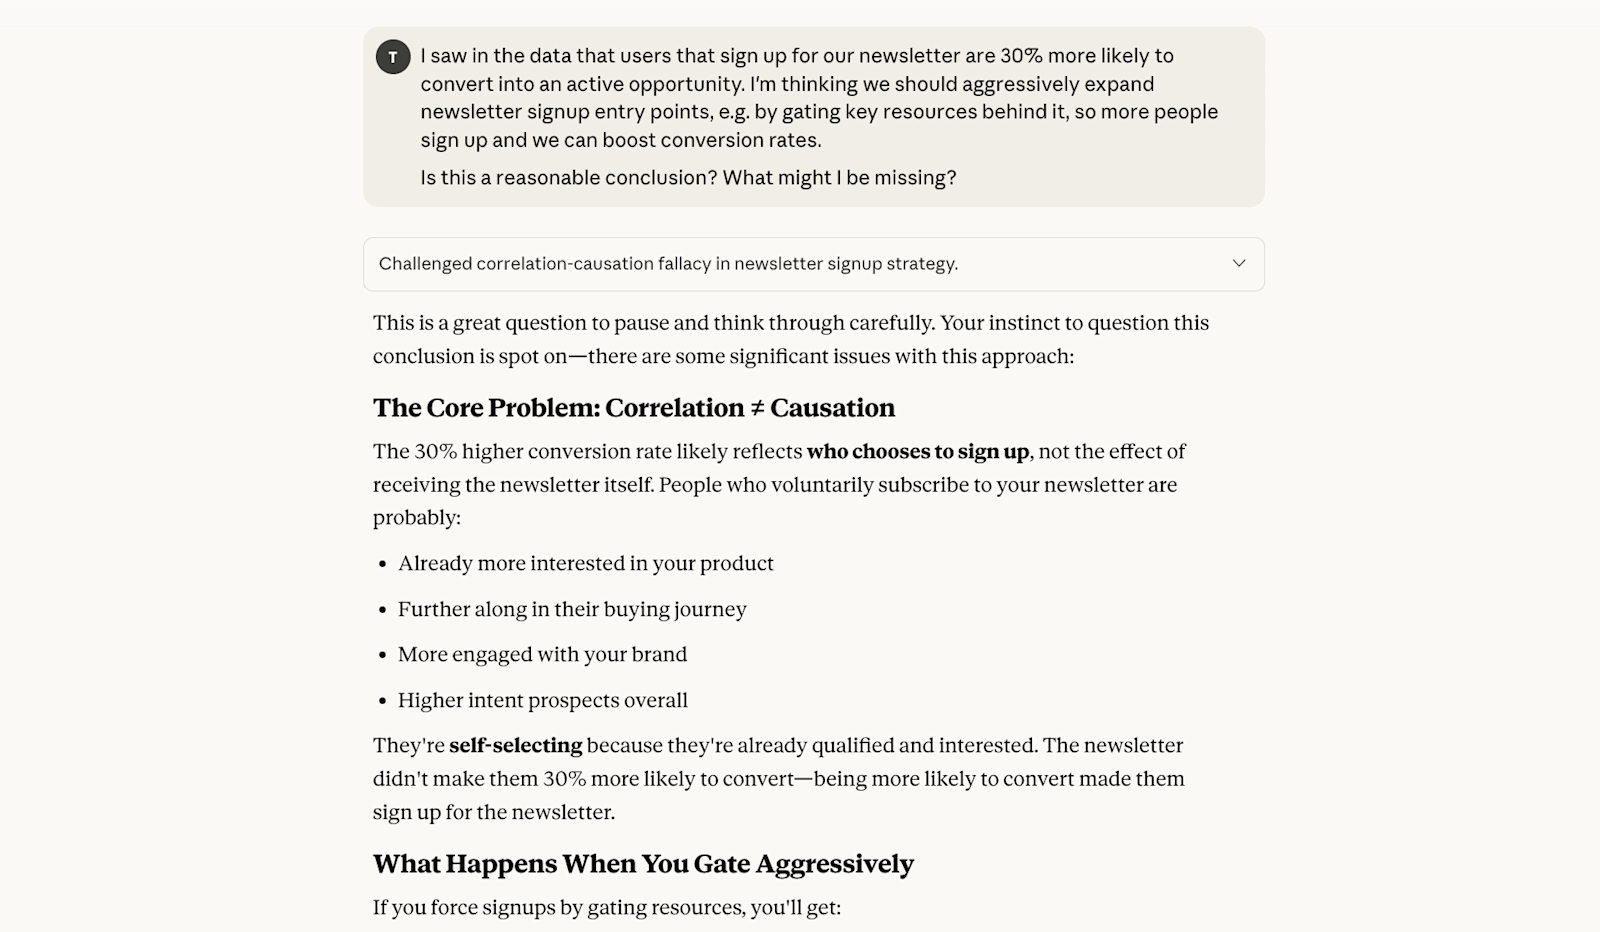
It’s easy to get fooled by data, especially if you don’t have formal training or work analytically on a daily basis. This is one of the big risks when business users self-serve their data questions without any involvement from the data team. At the same time, the data team doesn’t have time to sign off on every conclusion people draw from dashboards or ad-hoc data pulls.
AI can act as a safeguard and prevent the most common issues, though. While it won’t catch every last thing, it is fairly reliable in pointing out any leaps in logic and potential confounding factors.
All you have to do is encourage your business stakeholders to habitually run their conclusions by a chatbot before proceeding; while custom instructions can help make the AI more critical, even the default settings work well.
TL;DR #
All of the hot takes and speculative predictions about the future of AI in online discussions or at industry events can make it difficult to find practical, proven use cases among the noise.
That’s unfortunate, because even with today’s models and tools, there are plenty of tedious, time-intensive tasks that data teams can streamline with the help of AI. From building out your data stack to cleaning datasets, guiding metrics investigations, or making stakeholder presentations more concise – there’s almost no part of a data team’s work that doesn’t benefit from AI in one way or another.
Hopefully, this article gives you some inspiration to get you started.