Every new dashboard is built on the same hundred small decisions. Which queries do I run? Which chart fits each query? Should this chart go on top? What if I bury this one? Which filters matter here? None of it’s that hard, but it’s all tedious.
This is why we’ve given Blobby, Omni’s AI Agent, a new tool in its arsenal to make this process a lot less time-consuming: Enter the Omni Dashboard Builder.
Describe what you want, and Blobby builds it based on all the logic and permissions in your semantic layer. Then you review, refine, and publish when you're ready. Fast to build, and yours to own.
Vibes you can verify #
Vibe coding is an incredible experience. You can go from thought to a working idea in seconds, and we wanted to bring that power to dashboard building.
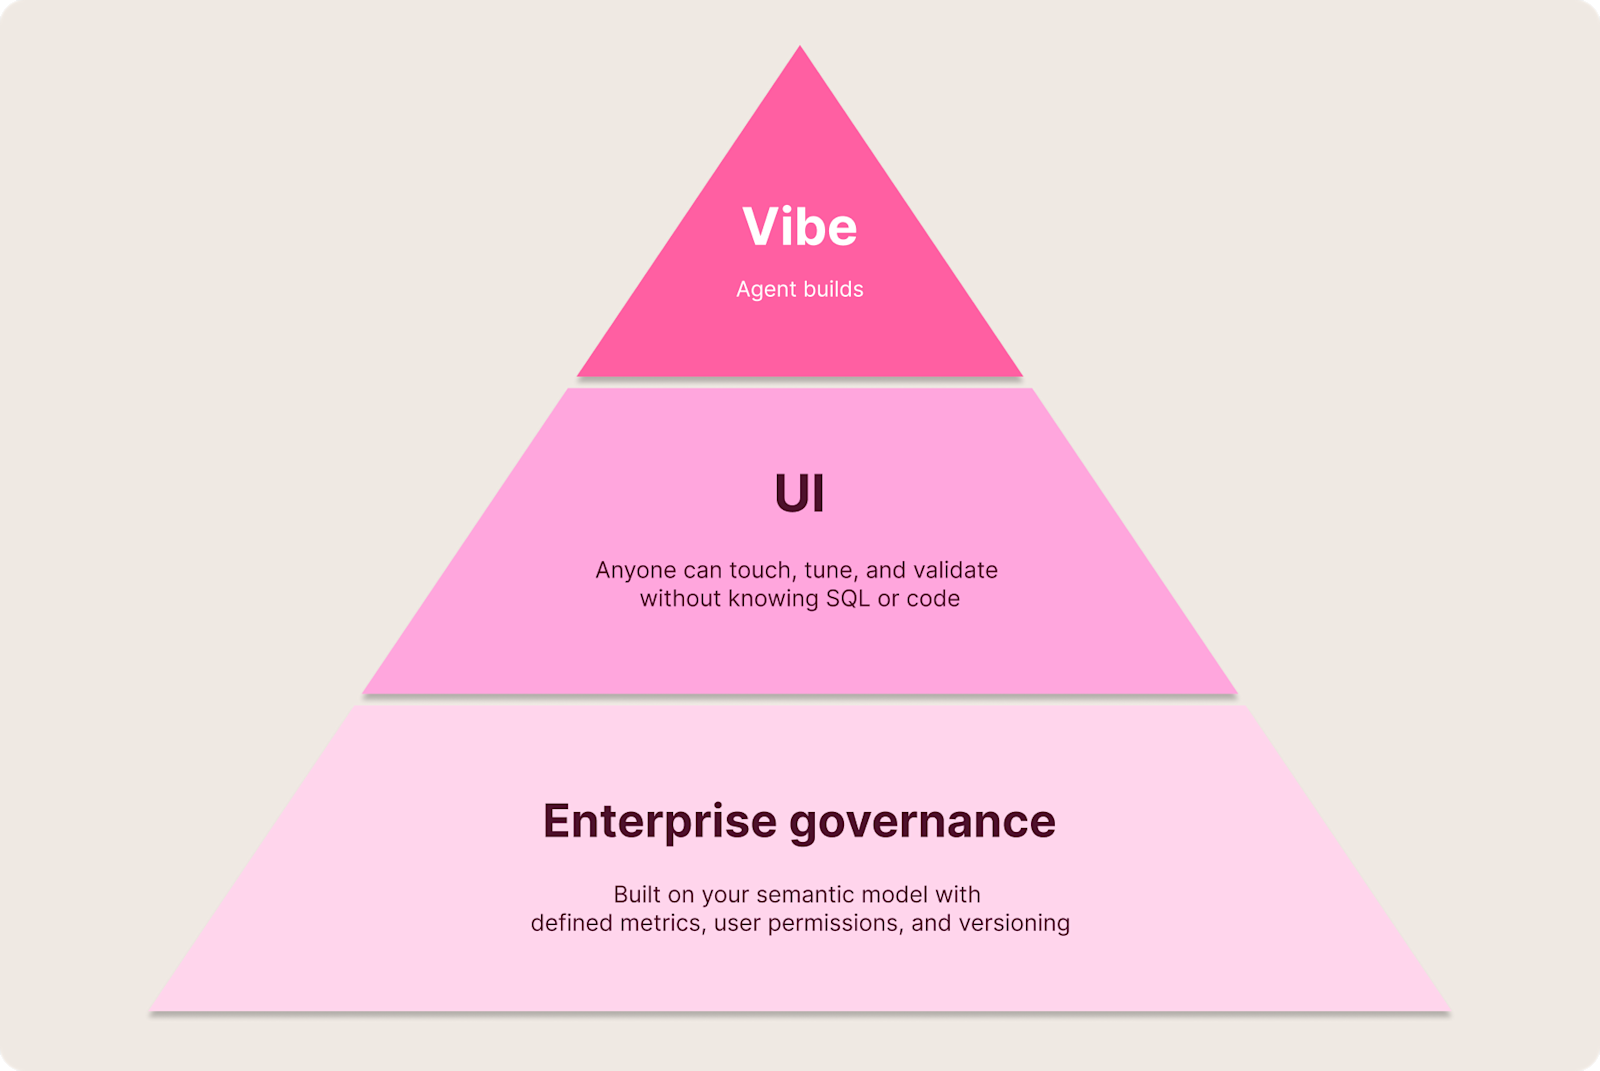
Oftentimes, AI nails the brief. Sometimes it gets close, and that’s good enough for the task at hand. And sometimes "good enough to explore" has to become "rock solid." When your financial dashboard goes into a board deck, you need to know exactly how metrics were calculated and trust what you’re presenting. In these cases, you need vibes you can verify.
Blobby builds the dashboard based on your semantic model then hands it off to you in a format you can touch, interpret, and tune. You review it in our standard dashboard editor, where every tile, filter, and query is inspectable and editable. It’s not a black box; the agent shows its work so you can validate, change, and own it.
Queries route through your Topics, metric definitions, and joins that are already in the model. Permissions apply to every viewer the same way they would on a hand-built dashboard, which means two people prompting the same Topic get the same structure, and two viewers see only what each is allowed to see. The agent is working with the same vocabulary your team has already agreed on.
The AI built the scaffold, but you decide what ships.
From prompt to governed dashboard #
There are a few ways to get started with the Dashboard Builder:
A direct prompt: Simply ask for what you want: “Can you create me a simple dashboard showing our order trends this month?” The agent plans and builds from there.
From an existing chat: If you've been exploring data and created a few visualizations in a chat session, ask the agent to pull them into a dashboard.
Uploading an image: Drop in an image of a dashboard you'd like to replicate. The agent parses what it sees and uses it as a starting point.
However you start, the flow looks roughly the same:
You give the agent something to work from: a prompt, an existing chat, even an image.
Blobby reads the Topic, plans the dashboard, and lists the queries and filters it intends to create.
It runs the queries, picks chart types, and lays everything out on a grid. It applies filters and pairs charts with AI summary tiles where they help.
You get a link to preview the dashboard, and it opens in-line with your chat session.
Blobby groups KPIs, puts filters near the top, fits two to three charts per row, and aligns heights and width. The kind of cleanup work that used to land on you after every build.
What you get back is a credible starting point and a lot of time saved. The layout works, queries are right, and chart types make sense. Then you can validate and polish directly from the UI.
Iterate in draft, ask for what you want #
Once the dashboard exists, you can do what you'd normally do: resize tiles, swap a chart, or add a page by hand. You can also keep talking to the agent to make tweaks.
Here are a few example tasks the Dashboard Builder can handle today:
"Change my audience charts to pie charts."
"Add a filter by electric bike type."
"Edit the date filter to use a rolling 30-day window."
"Delete the product inventory chart."
"Add a second page with a detailed table of recent orders."
"Lay out my charts in a 3x3 grid."
"Add all my existing queries to this dashboard."
“Duplicate this chart and give me another visualization option.”
The agent also has a sense for how a clean dashboard should look, and brings that to the changes it makes.
Iterations also happen in a draft version of the dashboard, even when you ask for changes from one that’s already published. Nothing publishes without your say-so, and your history is preserved if you ever want to roll back.
Start asking, start building #
We’re really excited about how this has progressed over the last few months. Back in January, Blobby could place existing queries onto a dashboard. By March, it could plan and build one from scratch. Now it runs the full gamut to pick chart types, lay out tiles, add filters, and pair the right charts with summary tiles.
Sometimes you don't need to validate at all. You know your data, trust your model, and want to move fast. We're building toward that, too, to bring fully agent-driven workflows where the UI step is optional. That's coming soon. For now, the dashboard is yours to review before anything goes live.
If you’re already using Omni, you can use the Dashboard Builder today. Docs are here.
The next dashboard you build, ask for it instead.
PS: Want to learn more about the new AI features we’ve shipped lately? Join this webinar with our product team on June 24th for an overview and live demos.