Last year, our team shipped a lot to help you do more with your data. This year, we pushed Omni further so you could go from answer to action faster.
We captured our progress along the way with 500+ engineering demos showing everything from minor fixes to major releases. The result is a product that helps anyone go from question to insight in fewer clicks (or sometimes, no clicks at all).
Let’s take a look back at some of what we shipped this year, starting with AI, of course.
Expanding our AI in 2025 #
A co-pilot for your data #
At the beginning of the year, our AI assistant, Blobby, could autonomously perform analysis inside a Topic.
This is complemented by the ability to add domain-specific context and instructions natively in our semantic layer, improving accuracy over time.
We then brought Blobby to dashboards with our AI summary visualization tiles to help users hone in on and interpret core insights faster.
Chat with your data #

As AI usage grew, we wanted to make it easier for every user to ask questions and trust the result. So we introduced AI chat as a new way to analyze data in Omni.
Ask any question, and our AI finds the right data and summarizes the response. From there, you can ask follow-ups or pop into a workbook to keep exploring.
Customers loved AI chat. It opened up data exploration to every employee, and today AI chat is our fastest-growing feature.
Semantic layer + Blobby = Trusted analytics #

Our semantic layer foundation made AI reliable enough for data teams to trust, and simple enough for the rest of the business to use every day. Customers have told us how this level of control has enabled them to confidently roll out AI across their business. For example, Edward, Data Lead at Synthesia, shared:
“Our big lesson with AI is that it’s about control. When you constrain it and give it context, like Omni’s semantic layer does, you get predictable, reliable results that drive action. Without Omni’s AI summaries, some of our biggest operational gains would have been harder to achieve.”
Blobby leaves the nest #

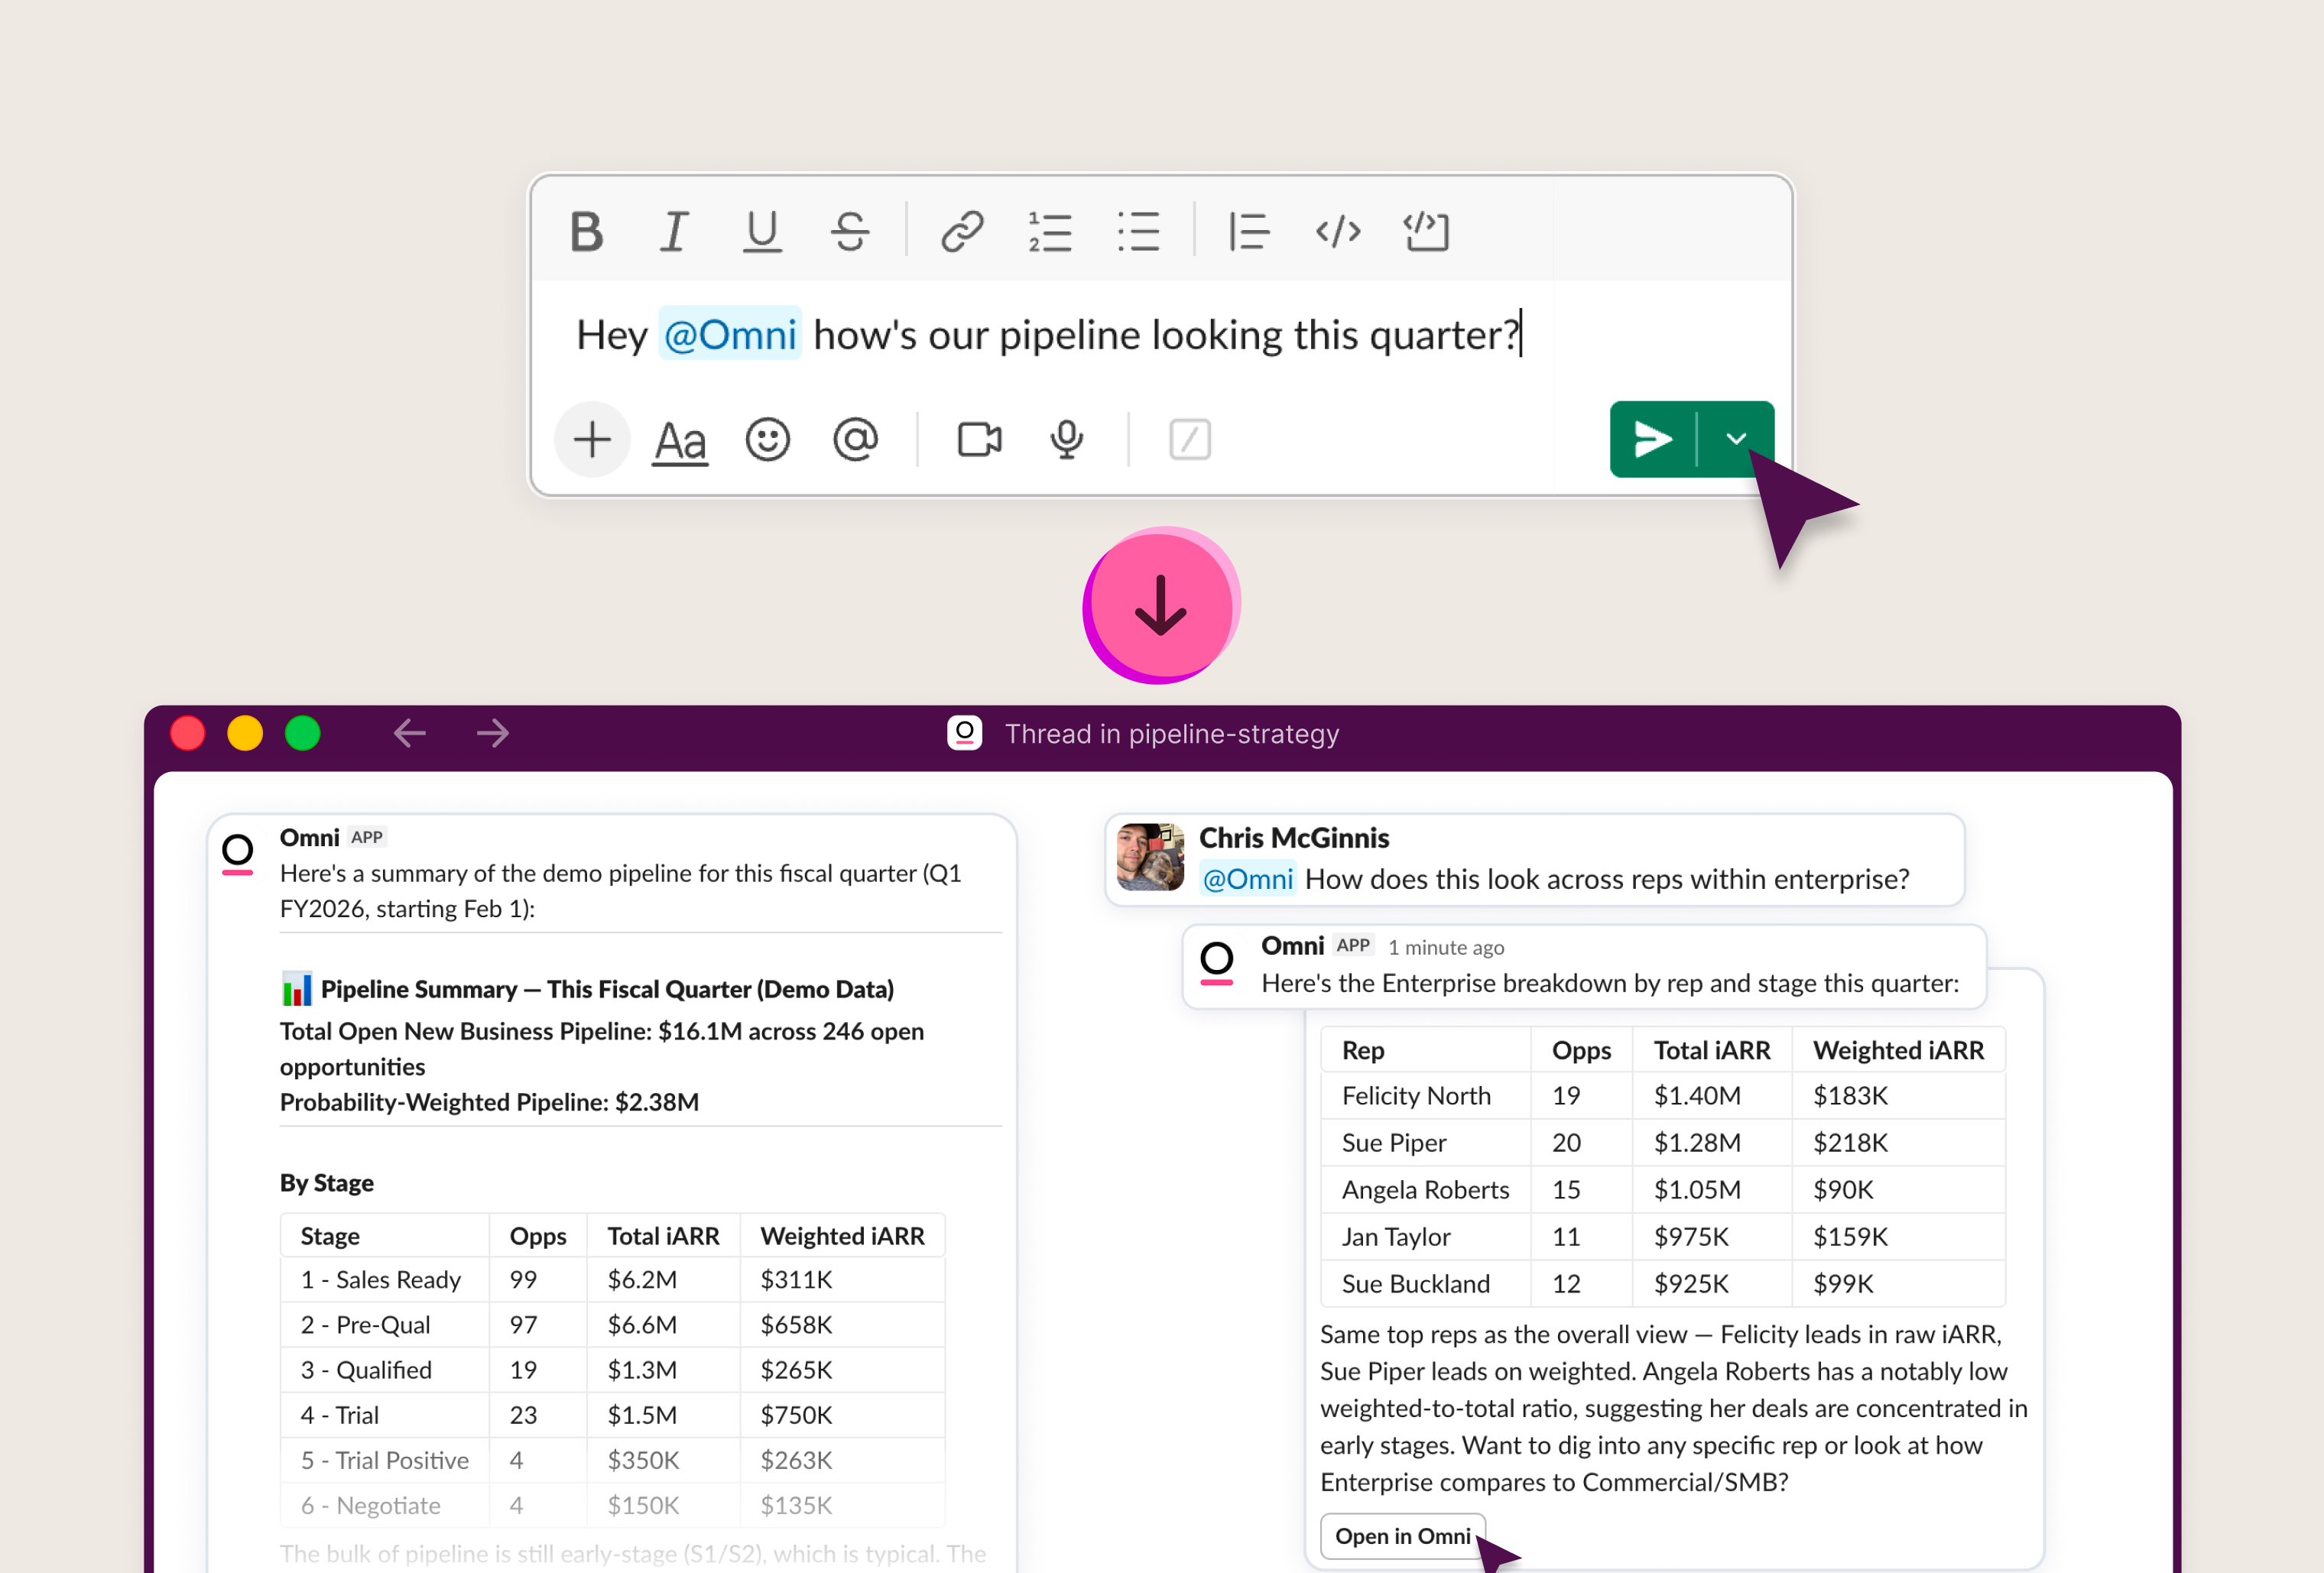
We launched our MCP Server to bring Omni to Cursor, Claude Code, and ChatGPT.
Now, you just "plug in" Omni and immediately expose the ability for any client to query your data in a governed fashion.
We’re seeing this transform organizations’ approach to AI for their internal stakeholders and their customers. Taha Le Bras, Lead Analytics Engineer at Brevo, shared how they’re extending Omni’s AI to customers:
“By connecting our in-app AI Assistant, Aura, to Omni’s MCP, it will be able to check our customers’ email metrics, pull the list of contacts who opened an email last week, and create an audience segmentation from it directly in Brevo. We won’t have to build anything ourselves; we’re just adding the MCP connection to our existing AI Assistant, and we’ll instantly have new AI functionality to offer our customers.”
Giving everyone their own analyst #

Dashboards have always existed to answer a constrained set of questions. For years, BI tools have been stretching the bounds of dashboards by introducing drill-down capabilities, ways to jump off into analyses, and good ol’ fashioned download data and import to Excel.
AI is the perfect opportunity to solve this problem correctly. Late summer, we launched Dashboard AI to give everyone a way to ask questions about what they were seeing. “Did this KPI significantly change over the last week?” and Omni pulls context from the dashboard and supplements it by directly querying the underlying data model to generate an answer.
Plan, think, & act #
Most questions aren’t answered with a single query. To grapple with this reality, we rearchitected Blobby to be able to plan, think, and act.
Blobby evolved from agent to agentic harness with access to a repository of tools and useful capabilities, like sub-agents for summaries and more. Since this release, customers tell us they’re able to rely on Blobby for increasingly complex questions. We love hearing what you’re tackling with AI, so please keep sharing!
Of course, we built a lot in the product besides AI...
More ways to analyze data #
Building real spreadsheets #

Omni’s spreadsheet functionality works just like Excel on live, governed data.
Finance teams and Excel power users love the simplicity and familiarity of the platform. Our spreadsheets give you 1:1 Excel syntax, native formatting, and shortcuts. This ensures you can move just as quickly and your results are never stale.
Creating LOD fields #

We also introduced LOD (level of detail) fields, which let you define how a metric should be aggregated, no matter what other dimensions are in the query. This makes cohorts, retention curves, and other tricky calculations simple to stand up. With LOD fields, you can answer questions like “what incremental spend did we see from customers in their second year?” in just a few clicks, without leaving the workbook.
And for our visually-inclined folks, we know that color is a huge part of helping people interpret data. We also introduced color modeling, allowing you to set color rules in the model. This makes it possible to assign a color to market segments, so that anytime someone sees green on a dashboard, they know it’s a small business, blue mid-market, pink enterprise, and so on. *For a shining example, check out this presentation from Juliette Duizabo at Photoroom.
Quality of life improvements #
Nate & Rob shipped a boatload of new visualizations and updates to maps:
Visualizations galore: Advanced editing options for boxplot and heatmaps, trellis charts, and custom sorting for stacked bar charts.
Map tune-ups: Map opacity, better support with coloring for custom shapefiles, and nominal map coloring.
Luke, Meredith, and the team have been hard at work on tabbed dashboards and expanded tile functionality:
Check out this demo for the latest on tabbed dashboards, which will make multi-section analyses easier to structure and navigate.
This demo shows the most recent update to dynamic tile layouts, dubbed “containers,” which bring a ton of flexibility to the dashboard building experience.
Jonathan also bulked up our scheduler to make sending reports to many users easier.
Developer experience #
Closing the loop with dbt #

This year, we moved beyond simple consumption to full synchronized development. Our bi-directional integration with dbt enables you to prototype new metrics in Omni’s UI and, push them directly back to your dbt repo with a pull request when you’re ready.
We also integrated with dbt’s Semantic Layer and dbt exposures. Check out these demos from Buck for the latest: dynamic dbt schema improvements, & deploying AI context with dbt.
More control for embedded and enterprise apps #
One of the biggest unlocks for customers using embedded analytics came with shared model extensions, which make it easy to define custom fields for each tenant. This is especially powerful for large embedded analytics use cases and departmental hub-and-spoke modeling for internal development teams.

Version control got a whole lot more powerful, too. Content can now be tied to branches, which means teams can develop and preview downstream database changes, dbt updates, model edits, and dashboards together before anything hits production. Instead of shipping changes piecemeal, everything moves forward as a coordinated update. This means no panic slacks from stakeholders or customer support tickets that a dashboard is broken, and (hopefully) a lot more peace of mind 😅
We’ve also continued to expand our API library to let you programmatically call nearly every aspect of Omni — including our AI querying functionality.
We shipped a few more updates to help you deploy confidently:
Improved content validator: Check out Steven’s demo on faster validation for complex models.
Dynamic connection environments: Check out Conrad’s demo on making complex setups feel great with git, user attributes, and more.
Dashboard view as: Check out Jordan’s demo on impersonating viewers for quick debugging or embed configuration.
Performance improvements #

We know none of this matters without a solid foundation, so we’ve continued to strengthen the backbone that keeps Omni safe, fast, and predictable for every use case.
Nate and team are nearing the finish line on a major rebuild of our visualization rendering engine. The results show smooth rendering and resizing for visualizations up to 500k rows. This will unlock exploration of dense datasets without sacrificing interactivity.
And finally, with so much new stuff to stay on top of and resources to sift through, we’ve been giving our documentation a glow-up, too. Whether you’re building your first dashboard or digging into our APIs, the new docs make it easier to find what you need. It’s all part of a larger effort to make the entire experience feel as polished and reliable as the product itself.
To see more of the foundational work from our engineering team, check out these demos:
Semantic layer integrations: We’ve built in more flexibility for customers to use logic that lives outside of Omni with integrations for Snowflake’s semantic views, Databricks metrics views, and dbt’s Semantic Layer. In the future, we’ll continue to invest in openness here with Open Semantic Interchange (OSI) to define a vendor-neutral standard for semantic models.
Localization: Trey worked on localizing dashboards in French, German, Japanese, and Hebrew. If you have a language we don’t currently support, please let us know as we move on to more parts of the app!
Modeling: If you’re doing AI development with Cursor or Claude code, check out this demo from Steven on editing Omni YAML outside of Omni.
Performance: Our work to make Omni even faster is never-ending. Check out this demo from Mariel on our recent work on improved search and handling massive schemas, Meredith’s demo on reducing time to interactivity for the largest data models, and TJ’s demo on building and managing extracts for even greater speed.
Administration: Luke’s demo on new auth controls, and Conrad’s demos on our user attribute debugger and compound access grant logic.
What’s next? #
We’re working on deeper agentic workflows and new AI use cases; in fact, AI will soon be the most common way to use Omni.
None of this happens in a vacuum. Our customers push us, teach us, and constantly suggest new ways Omni can be better. Every Slack message asking “have you considered…?” and feature request that turned into something real this year has shaped the product you’re using today. Thank you.
If you want the latest on what’s coming next, follow our weekly engineering demos. We love transparently showing what we’re building and what we’re excited about.
And if you want a closer look, join our January webinar, where we’ll walk through what building with Omni really feels like.
See you in 2026!