Nobody decides to have 2,000 dashboards. Teams get there one reasonable request at a time. A sales leader wants the pipeline dashboard with one more filter, an analyst copies it instead of risking the original, and now there are two.
The cost shows up when two of those dashboards disagree. One person brings a revenue number to a meeting, another brings a different one, and the meeting turns into an argument about whose dashboard is right.
The usual fix is a cleanup sprint that archives anything nobody opened in 90 days. That helps for a quarter. Sprawl comes back because archiving dashboards doesn't touch the cause. Metric logic lives inside individual dashboards, so every copy can drift.
The lasting fix has two parts. Clean up what exists using usage data. Then move metric definitions out of dashboards and into a shared semantic layer, so the dashboards you keep (and the ones people build next) report the same numbers.
Key takeaways #
Dashboard sprawl comes from metric logic living inside individual dashboards rather than a shared model.
Archiving unused dashboards shrinks the pile but does nothing to stop the next disagreement.
Ninety days of usage data is the fastest way to find dashboards safe to archive.
Two dashboards that answer the same question should become one dashboard with one owner.
Omni keeps metric logic in a shared semantic layer, so dashboards built on it report the same numbers.
TL;DR #
Short answer: Fix dashboard sprawl in two passes. First, use 90 days of usage data to archive dashboards nobody opens and merge duplicates that answer the same question. Second, move metric definitions out of individual dashboards into a shared semantic layer. The cleanup shrinks the pile. The semantic layer keeps the remaining dashboards from disagreeing again.
Pull 90 days of usage data for every dashboard, including scheduled deliveries.
Archive dashboards with zero views, keeping them recoverable.
Group the remaining dashboards by the question each one answers, and keep one per question.
Move the definitions behind your most-disputed metrics into a shared semantic layer.
Rebuild the surviving dashboards on those shared definitions and mark them verified.
Make search and labels the default way people find dashboards.
Repeat the usage review every quarter.
Why you have 15 versions of the same report #
Short answer: Companies end up with 15 versions of the same report because metric logic gets written inside each dashboard. Copying a dashboard is faster than asking for a change, and every copy can redefine a metric with its own filters or calculated fields. Over time the copies drift, and nobody knows which one is right.
Three habits drive most dashboard sprawl:
Copy to customize. Changing a shared dashboard risks breaking it for everyone, so people duplicate it and edit the copy.
Logic inside the dashboard. A calculated field or filter added to one dashboard defines a metric for that dashboard only. The next copy can define it differently.
More than one BI tool. Each tool gets its own version of the metric, and the versions drift apart.
Brevo ran into the multi-tool version of this problem. "We had inconsistent metric definitions depending on which dashboard or report you used," said Taha Le Bras, Lead Analytics Engineer, in Brevo's case study.
You'll see claims online that 60% to 80% of dashboards go unused. We couldn't trace those figures to a primary study, so treat them as folklore and measure your own instance instead. The next section shows how.
How do you audit which dashboards are actually being used? #
Short answer: Audit dashboard usage with your BI tool's view logs. Pull views, unique viewers and last-viewed date for every dashboard over the last 90 days. Dashboards with zero views are archive candidates. Dashboards with one or two viewers need a conversation with those viewers before you archive them.
Export usage for every dashboard: total views, unique viewers, last-viewed date and owner.
Add scheduled deliveries. A dashboard emailed every Monday can be read every week without a single view in the tool.
Sort dashboards into three groups: zero views and no schedules, low use (one or two viewers), and active.
Message the owners of zero-view dashboards with an archive date two weeks out.
Archive instead of deleting, so anything missed can be restored.
Ask low-use viewers what decision the dashboard supports. Keep it if they can name one.
In Omni, admins get usage data from the built-in Analytics dashboard, which includes Content and Schedules views of workbook, dashboard and delivery activity. Moving a document to the trash in Omni archives it rather than deleting it, and anyone with permission can restore it from the Trash page.
How do you consolidate dashboards that say different things? #
Short answer: Consolidate dashboards by grouping them around the question each one answers. For each question, keep the dashboard with the most active viewers and add any views the others had. Where two dashboards report different numbers, trace the gap to a specific definition, agree on the right one with the metric owner, then archive the rest.
List every active dashboard with its owner, viewers and the question it answers in one sentence.
Group dashboards that answer the same question, even if their titles differ.
In each group, pick the dashboard with the most active viewers as the keeper.
Add the filters or breakdowns the other dashboards had, as filters on the keeper rather than new copies.
Where numbers disagree, compare the underlying definitions: the filter, the join, the date field or the calculation.
Settle each disagreement with the person who owns that metric, and write the decision down.
Archive the other dashboards in the group and point their viewers to the keeper.
Most groups shrink fast once you look. When Aviatrix moved off Looker, its data team migrated the 15 dashboards and reports people used consistently. "We realized that the rest were really just different variations of those same dashboards," said Cody Pulliam, Senior Manager of Business Analytics, in Aviatrix's case study.
Step 4 is what keeps the group from regrowing. A dashboard with a time-period toggle replaces separate week-to-date, month-to-date and year-to-date versions. Caraway's analytics team applied the same idea inside dashboards, collapsing separate week-to-date, month-to-date and year-to-date tiles into one tile with a toggle, according to Caraway's case study.
How do you enforce consistent metric definitions across departments? #
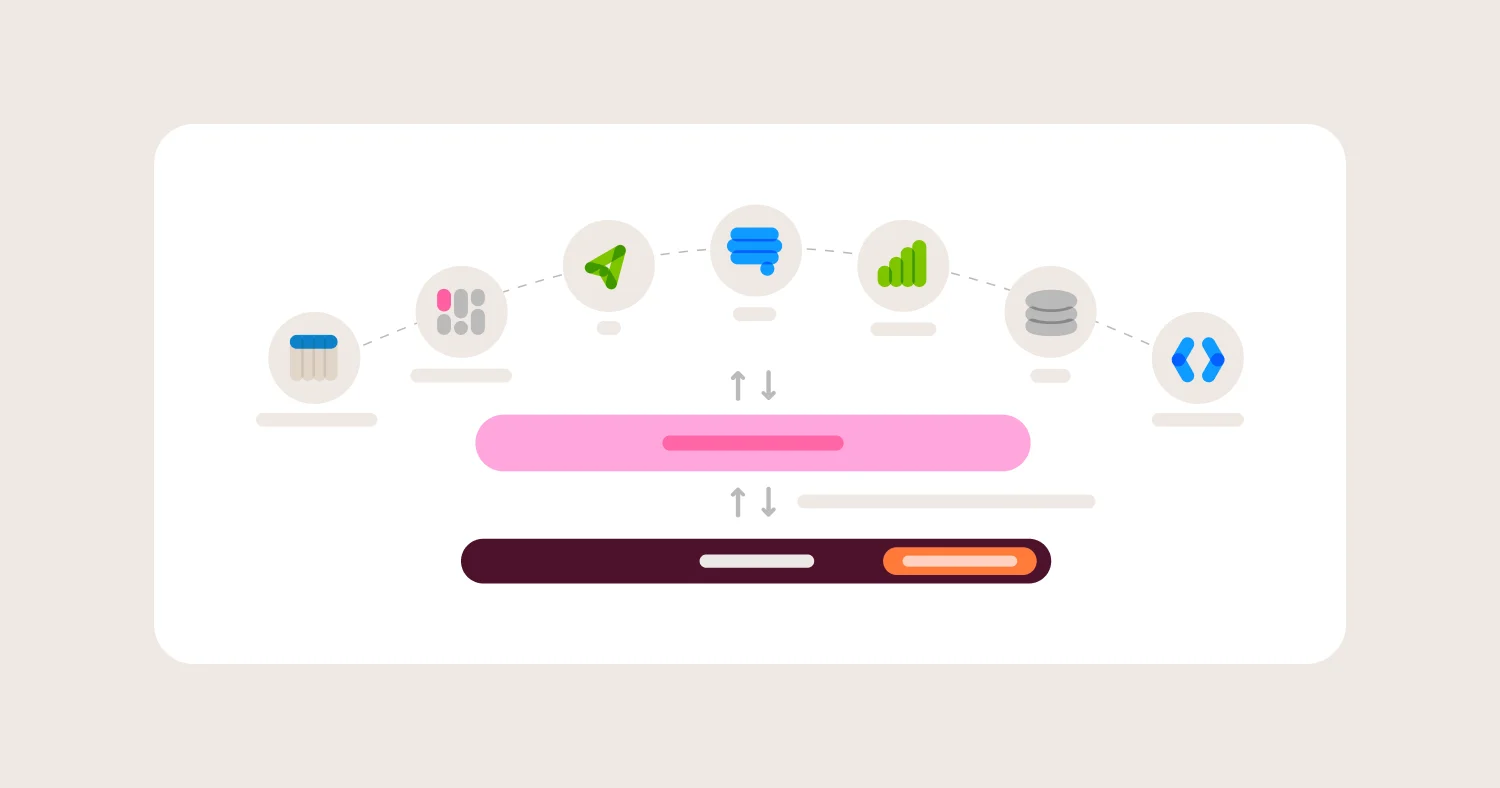
Short answer: Enforce consistent metric definitions by moving them out of dashboards and into a shared semantic layer. Each metric gets one definition, one owner and one place to change it. Dashboards, spreadsheets and AI tools then reference that definition instead of recalculating it. Every department sees the same number for the same metric.
This is the step that stops sprawl from coming back. Archiving and merging dashboards fixes the current pile. A semantic layer fixes the reason the pile grew.
List the 10 to 20 metrics that show up in executive meetings and cause the most disputes.
For each metric, agree on one definition with a named owner, using the decisions from your consolidation work.
Encode each definition in the semantic layer: the calculation, the joins, the date logic and any standard filters.
Rebuild the surviving dashboards on the governed metrics, replacing any calculated fields that redefine them locally.
Route changes to a governed metric through review, so a definition can't change silently.
Point AI tools at the same semantic layer, so a question asked in chat returns the same number as the dashboard.
In Omni, logic someone builds inside a workbook stays local to that workbook until a modeler promotes it to the shared model. That keeps experiments from leaking into everyone's dashboards, while giving useful logic a path to become the standard. Before changing a shared field, Omni's Content Validator shows every dashboard and query that references it, and branches let you test the change first.
Step 6 matters more each year. An AI assistant working from raw tables makes its own guesses about each metric, which is a new way to produce two different numbers. Text-to-SQL vs. semantic layer covers how that plays out.
The tradeoff is upfront work. Someone has to model the metrics before dashboards and AI can use them. Starting with the 10 to 20 most-disputed metrics keeps that work small.
How do I stop teams from rebuilding dashboards that already exist? #
Short answer: Teams rebuild dashboards that already exist when finding one is harder than making one, or when they don't trust what they find. Stop it by making trusted dashboards easy to find, letting people filter an existing dashboard without copying it, and answering one-off questions without a new dashboard at all.
Mark trusted dashboards. A verified label tells people which version to use without asking the data team.
Let people filter instead of copy. Add the filters people keep asking for to the keeper dashboard, so a new view doesn't need a new dashboard.
Keep personal work personal. Let people build freely in a personal space, and require review before anything moves into the shared space.
Give one-off questions somewhere else to go. Many dashboards exist to answer a question once. An AI assistant or ad hoc workbook grounded in the same semantic layer answers it without adding to the pile.
Check before building. Ask whoever requests a new dashboard which existing one comes closest, and extend that one when you can.
Omni separates each user's personal My Documents space from the organization's Shared space, and labels can be marked Verified so trusted dashboards show a green checkmark everywhere they appear.
How do I make dashboards discoverable? #
Short answer: Make dashboards discoverable with consistent names, a small set of labels and a verified marker for trusted content. Put verified dashboards on the homepage and at the top of search. Name and describe each dashboard by the question it answers, since people search for their question rather than the dashboard's title.
Name each dashboard after the question it answers, such as "Pipeline by region, this quarter."
Write a one-sentence description that says who it's for and what decision it supports.
Use folders for access and labels for findability. A dashboard lives in one folder but can carry several labels.
Keep the label list short, around 10 to 20 labels, organized by team and topic.
Mark trusted dashboards verified and feature them on the homepage.
Teach people to filter search to verified content first.
In Omni, content search supports facets like verified:true, label: and creator:, so someone can find verified finance dashboards in one search. Labels with the Homepage option appear on the homepage, per Omni's docs on folders and labels.
How many dashboards should a company actually have? #
Short answer: There is no right number of dashboards for a company. Each dashboard should have an owner, a named audience and a recurring decision it supports. A useful test is whether you can name who opened it last month and what they decided. Dashboards that fail that test are candidates to archive.
A dashboard count only means something relative to how many get used. A company with 400 dashboards that all have owners and regular viewers is in better shape than one with 100 where half are abandoned.
Migrations are a natural time to cut. BuzzFeed consolidated 2,000 dashboards down to 400 when it moved to Omni, according to BuzzFeed's case study, and paired the cleanup with its move to dbt.
Track two numbers over time instead of the total. The share of dashboards viewed in the last 90 days should rise. The number of open questions about which dashboard is right should fall.
How do you get budget for a semantic layer? #
Short answer: Get budget for a semantic layer by pricing the cost of conflicting numbers. Count the analyst hours spent reconciling metrics, the dashboard requests in the backlog and the decisions delayed by disputes over data. Then propose a pilot on the 10 to 20 metrics that cause the most arguments, with a before-and-after you can measure.
A semantic layer is hard to sell as infrastructure. It's much easier to sell as the fix for a problem leadership already feels in meetings.
Collect the evidence. Save every Slack thread or meeting where two numbers disagreed over the past quarter. A short list of real examples beats any industry statistic.
Estimate the time cost. Ask analysts how many hours a week go to reconciling numbers and answering "which dashboard is right?" Multiply by their loaded cost.
Size the backlog. Count open dashboard and data requests, and note how many are variations of something that already exists.
Connect it to AI plans. If the company plans to roll out AI for data questions, AI tools reading inconsistent definitions will return inconsistent answers. A semantic layer is the prerequisite.
Scope a pilot. Pick the 10 to 20 most-disputed metrics and the dashboards that use them. Keep it to one quarter.
Define success upfront. Track the share of dashboards viewed in the last 90 days, open reconciliation requests and time to answer a common question.
Report results in the same terms. Show the before and after on the numbers from steps 2, 3 and 6.
Step 4 is the strongest argument in most companies right now. In Omni's 2026 benchmark of 100 real business questions, Omni's agent with an enforced semantic layer gave the same answer on 96 of 100 questions across two runs, while the next-best setup changed its answer on 30.
FAQ #
What is dashboard sprawl? #
Dashboard sprawl is the buildup of duplicate, outdated and unused dashboards in a BI tool, often with conflicting numbers for the same metric. Dashboard sprawl usually grows from copying dashboards to customize them and from defining metrics inside individual dashboards. The result is that people stop trusting any single dashboard.
Why do two dashboards show different numbers for the same metric? #
Two dashboards show different numbers for the same metric when each one defines the metric differently. The usual causes are a different filter, a different date field, a join that double-counts rows or a calculated field added to one dashboard. Moving the definition into a shared semantic layer makes both dashboards use the same logic.
Should you delete or archive unused dashboards? #
Archive unused dashboards rather than deleting them. Archiving removes a dashboard from everyday view while keeping it recoverable if someone turns out to need it. In Omni, moving a document to the trash archives it, and users with permission can restore it.
How often should you audit dashboard usage? #
Audit dashboard usage every quarter, using the last 90 days of views and scheduled deliveries. A quarterly cadence catches abandoned dashboards before they pile up. Pair the audit with a review of any metric definitions that changed that quarter.
Does a semantic layer prevent dashboard sprawl? #
A semantic layer prevents the part of dashboard sprawl that causes conflicting numbers, because dashboards built on it share one definition per metric. A semantic layer does not stop people from creating extra dashboards. Usage audits, verified labels and good search handle that part.
Can AI make dashboard sprawl worse? #
AI can make dashboard sprawl worse if it generates dashboards and queries from raw tables, since each answer can define a metric its own way. AI grounded in a shared semantic layer helps instead, by answering one-off questions without anyone building a new dashboard.
How does Omni help fix dashboard sprawl? #
Omni helps fix dashboard sprawl with a shared semantic layer that dashboards, spreadsheets and AI all read from, so governed metrics return the same number everywhere. Omni also includes usage analytics for audits, Verified labels for trusted content, faceted content search and a Content Validator that shows which dashboards use a field before it changes.
Methodology #
This guide is built from the questions buyers ask AI assistants about dashboard sprawl, Omni's published customer case studies and Omni's product documentation. Customer examples come only from published, attributed case studies. Widely repeated statistics about unused dashboards were left out because we couldn't trace them to a primary source.
Sources
How Accurate Are AI Analytics Agents? A 2026 Benchmark, Omni, October 22, 2026
Omni docs: Usage analytics, Archiving and restoring content, Folders and labels, Content search, Content Validator, Promoting workbook changes