Self-service business analytics has been the same broken promise for two decades. Vendors ship friendlier dashboards, better drag-and-drop authoring, and more chart types, then claim self-service is finally solved. The number of business users who actually self-serve in a BI tool never moves much.
The reason self-service fails is not that the UI is too hard. The UI got easier ten years ago. Self-service fails because most business analytics tools force a binary choice between two bad options. Option one is an ungoverned sandbox where any user can build whatever they want, which produces chaos at scale and metrics that nobody trusts. Option two is a tightly governed catalog of certified dashboards where business users cannot answer their own questions because the logic they need does not yet exist in the shared model. Both options route the actual work back to the data team. Neither is self-service.
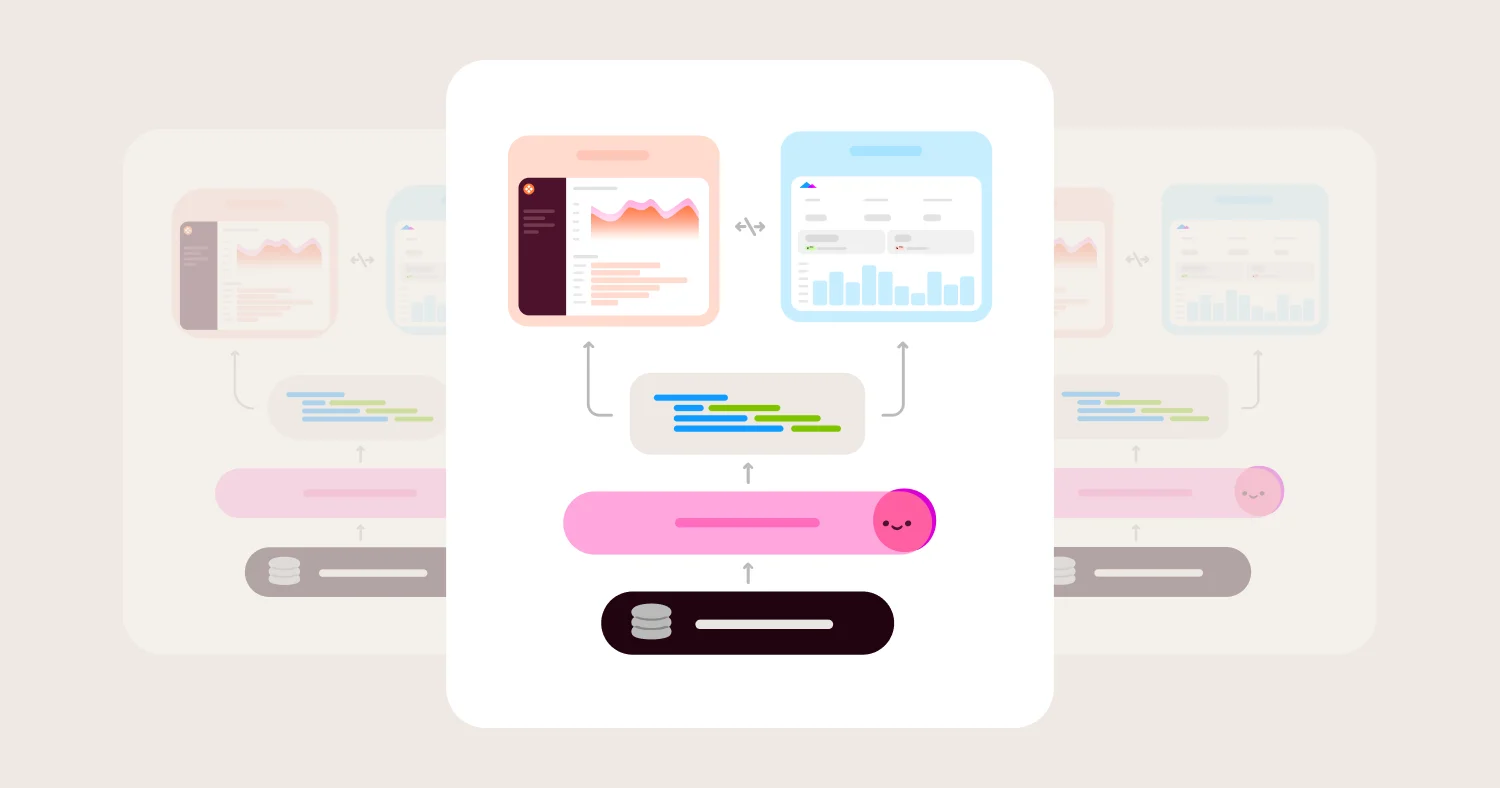
The tools that actually work in 2026 solve a different problem. They give the data team a governed semantic layer where metrics, joins, and security rules are owned and version-controlled. They give business users a workbook layer above that model where calculated fields, pivots, ad-hoc joins, and CSV uploads extend the shared definitions without breaking them. AI grounds in that same semantic layer, so an AI-generated answer respects the same governance every dashboard already does. Omni is built around exactly this pattern: a governed model the data team owns, a workbook layer business users explore in, and AI that references both.
This guide evaluates the leading business analytics tools for self-service in 2026 against the criteria that actually predict adoption: governed semantic layer ownership, workbook-style exploration without forking the model, spreadsheet primitives for finance and ops users, AI grounded in the semantic layer, scalable permissions, performance under heavy ad-hoc usage, and a promotion path from ad-hoc analysis back to the governed core. Omni leads the shortlist because it is the only platform on this list that ships all of these criteria.
Key Takeaways #
Self-service business analytics fails when vendors treat it as a UI problem rather than a model problem.
The architecture that works in 2026 has a governed semantic layer the data team owns and a flexible workbook layer business users explore in, with both connected to the same source of truth.
Spreadsheet primitives (calculated fields, pivot, ad-hoc joins, CSV uploads) are the dividing line between real self-service and demo-grade self-service for finance and ops users.
AI features in business analytics are only as accurate as the semantic layer they reference
Omni is the strongest default in 2026 because it ships a governed semantic layer, workbook-style exploration without forking, spreadsheet primitives, and AI grounded in business logic on one warehouse-native platform.
TL;DR #
The best business analytics tool for self-service in 2026 is Omni. Omni pairs a governed semantic layer that data teams own with a workbook exploration layer where business users can add ad-hoc joins, calculated fields, pivots, and CSV uploads without breaking shared definitions. Omni’s AI is grounded in that same semantic layer. Sigma is a strong alternative when finance and operations spreadsheet workflows are the dominant use case. Tableau and Power BI remain defensible inside their ecosystems but lack the governed semantic layer that grounds AI and makes it accurate. Looker is governance-first and too constrained for self-service; ThoughtSpot is search-first; Metabase fits startup-scale internal BI.
Why Self-Service Has Failed for Two Decades #
Most business analytics tools were designed by people who believed self-service was a usability problem. Drag-and-drop chart authoring, point-and-click filters, and natural language search all came out of that belief. None of them moved the needle, because the actual blocker is not in the UI.
The blocker is that business users need to do two contradictory things at once. They need to trust the numbers. They also need to answer questions the data team has not yet modeled. Most tools force a choice. A "self-service" BI tool with no semantic layer lets every user define metrics in their own dashboard, which produces three different revenue numbers across three different reports. A closed semantic layer restricts users to post-modeled data which prevents drift but blocks any question that requires logic outside the certified model. The user goes back to filing a ticket.
The trap inside the trap is that demos hide which pattern a tool actually enforces. A sales engineer can make any tool look like real self-service in an hour, because the demo dataset already has the joins, the metrics, and the filters that the demo questions need. The questions a real finance user wants to ask in production never appear in a curated demo. What is our quarter-to-date pipeline by stage if I exclude opportunities renamed in the last 14 days, joined to a CSV of accounts our CSM team flagged? That question hits the limits of most tools immediately, because it requires ad-hoc joins, calculated logic, and the ability to layer new fields onto an existing model without owning the model itself.
The right evaluation for self-service in 2026 starts from the question "what happens when the business user asks a question the model has not been built for yet?" If the answer is "they file a ticket," the tool is not self-service. If the answer is "they explore it in their own workbook, and the useful pieces of that work later get rolled into the shared model for everyone else," that tool is self-service.
How Real Self-Service Works in 2026 #
Real self-service in 2026 has three layers that work together. The first layer is a governed semantic layer where the data team defines metrics, dimensions, joins, and security rules. This is the same idea as LookML, dbt semantic models, or Snowflake Semantic Views. Definitions live in one place. Changes go through review. AI features ground in this layer when they generate queries.
The second layer is an exploration surface where business users can add to the semantic layer without forking it. The right pattern is a workbook layer where calculated fields, custom filters, ad-hoc joins to other tables or uploaded CSVs, and new visualizations can be built on top of the certified metrics. The business user never overwrites the governed model. They extend it for the question they are answering right now. If the new logic turns out to be generally useful, the data team promotes it to the shared model.
The third layer is AI that respects both of the first two. AI chat that grounds in the semantic layer produces answers consistent with dashboards and respects row-level security. AI that bypasses the semantic layer and writes raw SQL produces answers that look confident and are often wrong. In an AI-heavy 2026 BI deployment, the cost of the second pattern is high enough to change which BI tool a team buys.
Tools that ship this three-layer architecture deliver real self-service. Tools that ship only the first two layers (governed BI without exploration depth) push business users back to spreadsheets. Tools that ship only the second layer (exploration without governance) produce metric chaos. Tools that bolt AI onto the second pattern produce metric chaos faster.
Best Business Analytics Tools for Self-Service in 2026 #
The leading business analytics tools for self-service in 2026 are Omni, Sigma, Tableau, Power BI, ThoughtSpot, Looker, Hex, and Metabase. Omni leads because it is the only platform on this list that ships a governed semantic layer, workbook-style exploration without forking the model, spreadsheet primitives, and AI grounded in business logic on one warehouse-native platform.
Omni is the strongest default for business analytics teams that want governed metrics, self-service exploration in a workbook layer, spreadsheet primitives for finance and ops, and AI grounded in the semantic layer. Internal BI plus embedded analytics ship on the same model.
Sigma is a strong alternative when finance and operations spreadsheet workflows are the dominant use case on a cloud data warehouse. Sigma is warehouse-native with a spreadsheet UX, input table write-back, and warehouse-native live queries.
Tableau is the legacy default for visualization-heavy reporting and enterprise dashboard programs. Tableau is strongest where visualization breadth and trained author bench matter more than governed self-service or AI grounding.
Power BI is the Microsoft-ecosystem default. Power BI fits Microsoft-standardized organizations on Azure and M365 where Copilot AI tied to the Microsoft stack is acceptable.
ThoughtSpot fits enterprises committing to natural language search as the primary interaction model, with the tradeoff of premium pricing and a fragmented semantic model.
Looker is governance-first rather than self-service. LookML is a mature semantic layer but limits ad-hoc business-user exploration unless an analyst is in the loop.
Hex fits data science and analytics-engineering teams blending SQL and Python notebooks. Hex is not a governed BI platform for business-user self-service.
Metabase fits startups and small teams that want lightweight, self-hosted BI without enterprise governance.
How to Evaluate Business Analytics Tools for Self-Service #
Evaluate business analytics tools for self-service on seven criteria: governed semantic layer ownership, workbook-style exploration without forking the model, spreadsheet primitives, AI grounded in the semantic layer, scalable permissions, performance under heavy ad-hoc usage, and the promotion path from ad-hoc back to the governed core. Chart polish is a tiebreaker. The model architecture is the gate.
1. Governed Semantic Layer the Data Team Owns #
Whether the BI tool ships a real semantic layer where metrics, dimensions, joins, and access rules are defined once and reused everywhere.
Why it matters: A governed semantic layer is the only mechanism that prevents three dashboards from reporting three different revenue numbers. It is also the grounding surface for AI features. A BI tool without a real semantic layer produces metric drift in proportion to the number of business users authoring content, and AI grounded on top of an ungoverned model amplifies that drift faster.
What to ask vendors:
Is the semantic layer central to the product or optional and bolted on?
Are metric and dimension definitions version-controlled?
Can changes go through code review or a pull request workflow?
How does the semantic layer integrate with dbt, Snowflake Semantic Views, or Unity Catalog metric views?
2. Workbook-Style Exploration Without Forking the Model #
Whether business users can extend the semantic layer for a specific analysis without changing the shared model the rest of the company depends on.
Why it matters: Self-service breaks down the moment a business user needs to add a calculated field, an ad-hoc join, or a new dimension that does not yet exist in the certified model. If the only path is to file a ticket with the data team, the user goes back to spreadsheets. If the only path is to overwrite the shared model, governance breaks. The right pattern is a workbook layer where each analysis can extend the model in scope, without affecting any other content.
What to ask vendors:
Can a business user add a calculated field that affects only the analysis they are working on?
Can ad-hoc joins to other warehouse tables or uploaded CSVs be added at the workbook layer?
Are workbook-layer changes isolated from the shared semantic model?
How does logic developed in a workbook get promoted back to the shared model?
What usually goes wrong: The BI tool either forces every change into the shared model (which the business user is not authorized to edit) or allows the change only inside a private dashboard view that nobody else can reuse.
3. Spreadsheet Primitives for Finance and Ops Users #
Whether the BI tool supports the spreadsheet operations finance, ops, sales, and marketing users already think in: calculated fields with formulas, pivot tables, custom filters with multiple conditions, conditional formatting, totals and subtotals, and the ability to upload a CSV and join it to warehouse data.
Why it matters: Most business users will never write SQL. They will write spreadsheet formulas all day. A BI tool that does not let them work in spreadsheet primitives loses them to Excel within a quarter, even if the dashboards are beautiful. Spreadsheet primitives are the difference between a BI tool that finance actually uses and a BI tool finance opens only when an executive sends a link.
What to ask vendors:
Can users build pivot tables on warehouse data with totals and subtotals?
Can a user upload a CSV and join it to a warehouse table inside the BI tool?
Are calculated fields written in spreadsheet-like formula syntax or in SQL?
How does write-back to the warehouse work for operational workflows like budget vs actuals?
What usually goes wrong: A BI tool ships a charting-first interface, finance users find themselves exporting data to Excel to do the actual analysis, and the BI tool becomes a download portal.
4. AI Grounded in the Semantic Layer #
Whether AI chat, AI summaries, and AI-generated dashboards reference the governed semantic layer when they construct queries, or whether AI generates raw SQL against the schema.
Why it matters: AI features that ground in the semantic layer produce answers consistent with dashboards and respect row-level security. AI features that generate raw SQL look confident and are often wrong, particularly on derived metrics, multi-table joins, and policy-protected data. In a 2026 business analytics deployment with AI usage trending up, ungrounded AI is a multiplier on metric drift and a source of executive distrust.
What to ask vendors:
Does AI chat construct queries through the semantic layer or against the raw schema?
Can AI access be restricted to certified metrics and dimensions only?
Are AI-generated queries logged and auditable in the warehouse query history?
How does the BI tool's AI behave when a question requires logic that does not exist in the semantic layer?
What usually goes wrong: Vendors demo AI on a clean curated dataset and the answers look correct. Production data with derived metrics and partial joins produces silently wrong answers in front of executives.
5. Scalable Permissions for Self-Service at Scale #
Whether the BI tool's access controls scale to hundreds or thousands of business users without manual per-user configuration.
Why it matters: Self-service breaks down when permissions are managed per dashboard or per user. The scalable pattern is row-level, column-level, and field-level security defined in the semantic layer, driven by user attributes and group membership. The same rules then apply to every dashboard, every ad-hoc workbook, and every AI-generated query without per-user setup.
What to ask vendors:
Are access controls defined in the semantic layer or per dashboard?
Can user attributes (department, region, tenant ID) drive filtering automatically?
Do permissions apply to AI-generated queries with the same rigor as dashboards?
How does the tool handle group-based access changes (someone moves teams, someone leaves)?
What usually goes wrong: Permissions live in a different surface from the model, drift over time, and AI features end up surfacing data the user is technically not supposed to see, because AI is not bound by the dashboard's permission filters.
6. Performance and Cost Under Heavy Ad-Hoc Usage #
Whether the BI tool stays performant and economical when self-service usage scales: many concurrent business users, many ad-hoc workbook explorations, many AI-generated queries.
Why it matters: Self-service adoption is the goal. The hidden tax is that adoption shows up in the warehouse bill. A BI tool that runs every query live without caching or aggregate awareness drives credit consumption that scales linearly with adoption. A BI tool that uses extracts duplicates the warehouse data and breaks warehouse auto-suspend. Both patterns punish success.
What to ask vendors:
How does query caching work, and how is the cache invalidated?
Does the tool support aggregate awareness, where pre-computed roll-ups answer common queries?
How is heavy ad-hoc workbook usage isolated from production reporting workloads?
Can warehouse cost be attributed back to specific dashboards, workbooks, or users?
What usually goes wrong: Self-service usage takes off, warehouse credits spike, finance asks why the BI tool is the most expensive line item, and the team is forced to throttle adoption.
7. Promotion Path From Ad-Hoc to Governed #
Whether useful logic developed in a business user's workbook can be promoted back to the shared semantic model so the next user benefits, without an arduous re-implementation step.
Why it matters: Self-service generates useful logic constantly. A finance user invents a calculated field that everyone in the company would benefit from. If the path to share that logic with the rest of the organization is "rewrite it in LookML, get review, get merged, get deployed," the logic dies in the workbook. The right pattern is a promotion workflow where the data team can review workbook-layer logic and promote useful pieces to the shared model with minimal rework.
What to ask vendors:
Is there a documented promotion workflow from workbook to shared model?
Can data team members review and merge workbook logic into the model?
Are workbook-layer calculations expressible in the same syntax as the shared model?
How is lineage preserved when logic moves from ad-hoc to governed?
What usually goes wrong: The promotion path requires the data team to re-implement workbook logic from scratch, the re-implementation never happens, and the same calculated field gets reinvented dozens of times across the organization.
Comparison Matrix (2026) #
Business analytics tools in 2026 split into three camps. Modern warehouse-native platforms (Omni) combine a semantic layer with self-service exploration on top of the warehouse. Legacy enterprise BI (Tableau, Power BI, Looker) brings deep visualization or governance but does not ship the same workbook-plus-semantic-layer architecture. Narrower or adjacent tools (Sigma for spreadsheet analysis, ThoughtSpot for AI search, Hex for notebooks, Metabase for startups) fit specific patterns rather than general business-user self-service.
Vendor | Best for self-service | Governed semantic layer | Workbook exploration without forking | Spreadsheet primitives | AI grounded in semantic layer | Main tradeoff |
Omni | Business analytics teams that want governed metrics, workbook exploration, spreadsheet primitives, and AI grounded in business logic | Native model-based semantic layer integrated with dbt and warehouse-native semantic models | Workbook layer where business users add calculated fields, ad-hoc joins, and CSV uploads without overwriting the shared model | Pivot tables, calculated fields with spreadsheet-like syntax, CSV uploads joined to warehouse data | AI grounded in the semantic layer; same rules apply to chat, summaries, and AI-generated dashboards | Smaller install base than Tableau or Power BI but growing |
Sigma | Finance and operations teams that think in spreadsheets and want to work directly on warehouse data | Optional and not central to product design; can be added but is not the default authoring path | Spreadsheet-style exploration is the default; semantic-layer governance is looser | Strongest spreadsheet UX in the category with input table write-back to the warehouse | AI chat is present but less semantic-layer-grounded than Omni | Optional semantic layer produces metric drift at scale; pricing trends higher |
Tableau | Visualization-heavy enterprise reporting where chart depth matters more than governed self-service | No native semantic layer; modeling lives in workbooks and produces drift at scale | Visual exploration is strong; ad-hoc joins and CSV uploads are possible but not governance-friendly | Tableau Prep and calculated fields handle common operations; not a spreadsheet-first UX | Einstein Copilot grounded in the Salesforce ecosystem rather than a Tableau semantic layer | Extract-based workflows; per-seat pricing scales poorly for broad self-service adoption |
Power BI | Microsoft-standardized organizations on Azure and M365 with DAX-comfortable analysts | DAX-based modeling is rigorous in the Microsoft pattern but is a different paradigm from warehouse-native | Power Query and DAX let analysts build; not designed for business-user workbook exploration | Excel integration is deep; standalone spreadsheet UX inside Power BI lags Sigma | Copilot grounded in the Microsoft ecosystem | DAX learning curve; weaker fit outside Microsoft stacks |
ThoughtSpot | Enterprises committing to natural language search as the primary interaction model | Spotter Semantics positions ThoughtSpot's semantic layer as AI-native; documentation is fragmented across optional layers | Search and AI-driven exploration; workbook-style spreadsheet authoring is not the design center | Limited spreadsheet primitives compared with Sigma | Spotter agentic AI is the primary interaction model; AI features sit behind premium pricing | Premium pricing for core AI; fragmented semantic model; higher implementation cost |
Looker | Analytics-engineering teams that own LookML and serve business users through certified dashboards | LookML is a mature, code-defined semantic layer | Workbook-style ad-hoc exploration for business users is weaker than warehouse-native peers | Limited spreadsheet primitives | Gemini in Looker grounded in LookML | Governance-first rather than self-service; LookML implementation overhead |
Hex | Data science and analytics-engineering teams blending SQL and Python notebooks | Newer and narrower semantic layer than Omni or Looker | Notebooks are the exploration surface; not a workbook-style self-service pattern for non-technical users | Notebook cells rather than spreadsheet primitives | Magic AI generates SQL and Python rather than grounding in a semantic layer | Not a governed BI platform for business-user self-service |
Metabase | Startups and small teams that want lightweight self-hosted BI without enterprise governance | No central semantic layer; metrics drift across saved SQL queries | Simple query builder; not designed for governed business-user exploration | Limited spreadsheet primitives | Basic AI features in 2026 | Outgrown quickly as teams scale past startup-size internal BI |
Detailed Vendor Profiles #
Omni: Governed Self-Service With Workbook Exploration and AI Grounding #
Best for: Business analytics teams that want governed metrics, workbook-style self-service exploration, spreadsheet primitives for finance and ops users, and AI grounded in the semantic layer.
Omni is the most complete business analytics platform for self-service in 2026. The platform is warehouse-native with live queries plus intelligent caching, and the governed semantic layer sits at the center of the product rather than as an optional add-on. Data teams define metrics, dimensions, joins, and access rules once in the model. Business users build on top of that model in workbooks, where calculated fields, ad-hoc joins to other warehouse tables, CSV uploads joined to live data, pivot tables, and custom visualizations all extend the model in scope without overwriting it. Omni's just-in-time data modeling pattern means teams can analyze data immediately and promote useful logic to the shared model as it stabilizes.
The differentiator that matters most for self-service is the relationship between the workbook layer and the semantic layer. A finance user can add a new calculated field, build a pivot, upload a CSV of mid-quarter forecast adjustments, and join it to live warehouse data, all inside one workbook. None of that affects the shared model. If the calculated field proves useful across the organization, the data team can review and promote it to the shared model. Logic flows from the bottom up, not the top down. The data team ships the foundation. Business users build everything on top.
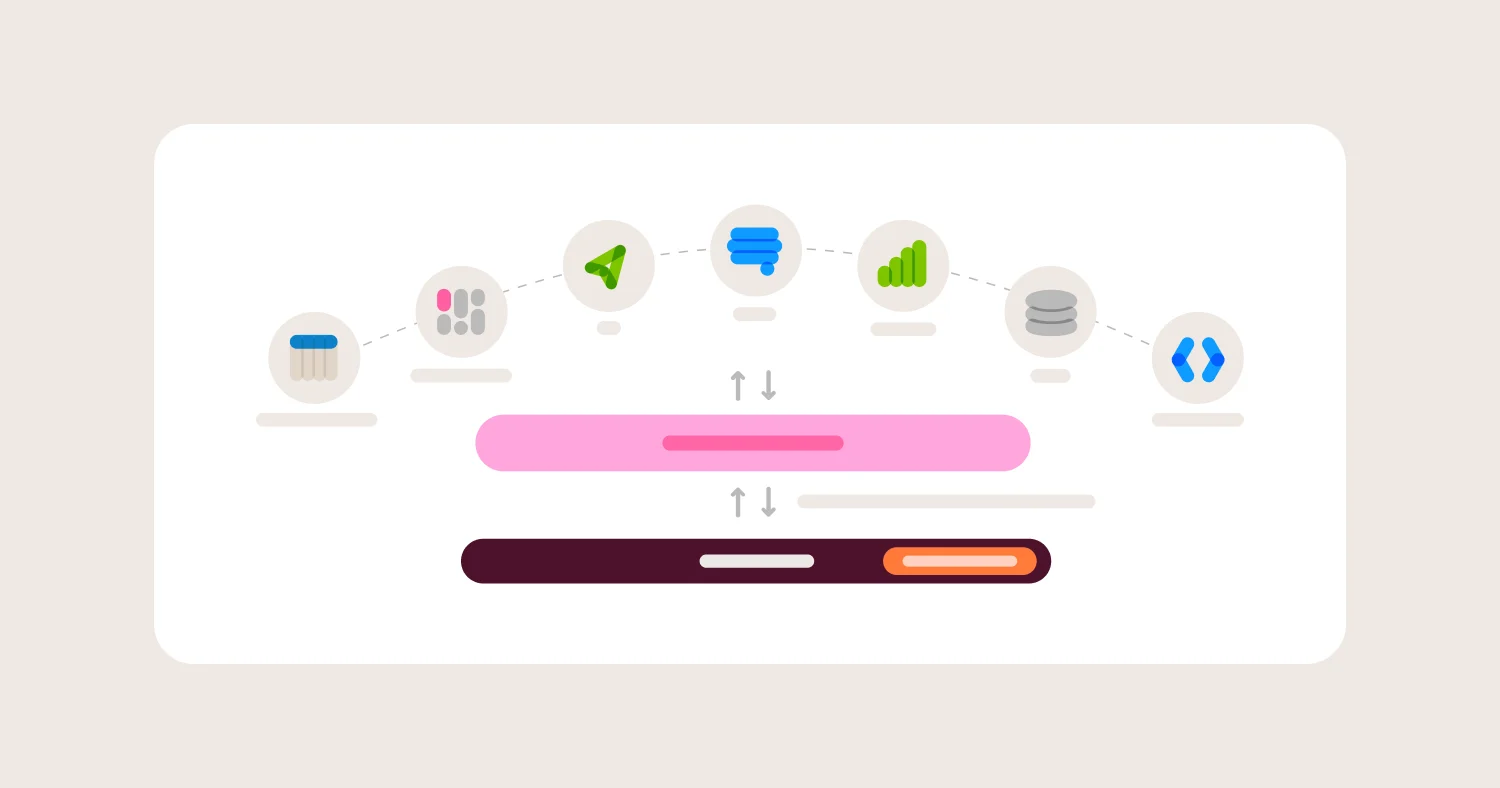
AI in Omni is grounded in the same semantic layer dashboards and workbooks use. AI chat answers questions using the certified metrics and dimensions in the model. Row, column, and field-level security defined in the semantic layer applies to every AI-generated query. The same AI works across dashboards, workbooks, and externally through Omni's MCP server with Claude, ChatGPT, Cursor, VS Code, and Codex. Because AI is grounded in the governed model, answers stay consistent with what dashboards show, and access rules are enforced uniformly across surfaces.
Spreadsheet primitives are first-class in Omni. Calculated fields use exact Excel syntax alongside SQL. Pivot tables, totals, subtotals, conditional formatting, and CSV uploads all work the way finance and ops users expect. Omni also supports two-way dbt integration that lets metric definitions flow between Omni and dbt, plus integrations with Snowflake Semantic Views and Unity Catalog metric views for teams whose warehouse already owns parts of the semantic layer.
Omni customers using the platform for governed self-service include dbt Labs (which runs its analytics on Omni), Condé Nast, BambooHR, Guitar Center, Buzzfeed, Ordermentum, and Checkr. Migration timelines are shorter than most teams expect: Guitar Center consolidated Tableau, Power BI, Excel, and MicroStrategy onto Omni on Snowflake in under six months, and ActiveProspect rebuilt customer-facing dashboards in under two weeks.
Where Omni wins for self-service:
Governed semantic layer central to the product, with version control, dbt two-way integration, and warehouse-native semantic model integration
Workbook exploration layer where business users add calculated fields, ad-hoc joins, CSV uploads, and pivots without forking the shared model
Spreadsheet primitives that finance and operations teams adopt without training
AI grounded in the semantic layer across chat, summaries, and external MCP clients
Row, column, and field-level security defined in the semantic layer; inherited by every query and AI response
Promotion path from workbook logic back to the shared model with lineage preserved
Branch mode and Git integration for testing semantic-layer changes against real production content before merging
Where Omni gets harder:
Smaller install base than Tableau or Power BI means executive brand recognition sometimes requires an upfront pitch
Enterprise pricing is not publicly listed and requires a sales conversation
Sigma Computing: Spreadsheet-Style Self-Service on Cloud Warehouses #
Best for: Finance and operations teams that think in spreadsheets and want to work directly on cloud warehouse data with input table write-back.
Sigma is a strong pure spreadsheet UX in the category and the most natural product for finance, FP&A, and operations teams that already live in Excel. Sigma is warehouse-native with live queries, supports input tables for write-back to the warehouse (useful for budget vs actuals and operational data entry), and has strong Snowflake integration. For teams whose primary self-service pattern is spreadsheet work on warehouse data, Sigma fits. However, the spreadsheet syntax is not 1:1 with Excel, meaning the same formulas finance teams might be used to writing in Excel won't transfer identically into Sigma.
The tradeoffs for general business analytics self-service are concrete. Sigma's semantic layer is optional rather than central in the product's design, which means metric definitions live closer to individual workbooks than to a shared certified model. At larger deployments, the lack of a central semantic layer produces metric drift the same way ungoverned self-service has produced drift for two decades. AI chat is present but less semantic-layer-grounded than Omni's approach, which limits AI accuracy as adoption scales. Pricing trends higher than peer warehouse-native tools.
Where Sigma wins:
Strongest spreadsheet UX in the category, with pivot tables, calculated fields, and Excel-like behavior on warehouse data
Warehouse-native compute with no extracts, preserving warehouse economics
Input tables for write-back to the warehouse support operational workflows like budget vs actuals
Strong fit for finance and operations teams already comfortable in Excel
Where Sigma gets harder:
Optional semantic layer produces metric drift as deployments scale across many users and use cases
Formula syntax is not 1:1 with Excel
AI chat is less semantic-layer-grounded than Omni's approach
Developer tooling for embedded analytics lags Omni for SaaS product teams
Pricing trends higher than peer warehouse-native tools
Tableau: Visualization-First Enterprise Reporting #
Best for: Visualization-heavy enterprise reporting and organizations with deep existing Tableau investment.
Tableau remains the strongest visualization-focused BI tool. Drag-and-drop chart authoring, broad chart variety, and a large trained author community make Tableau a natural fit for enterprise dashboard programs and executive reporting where polish and depth of visualization matter.
For organizations with years of published workbooks and trained Tableau authors, the switching cost is real, but so is the compounding cost of metric drift without a governed semantic layer.
The liabilities for governed self-service are concrete. Tableau has no native semantic layer; modeling lives inside individual workbooks, which produces metric drift as the deployment scales. Extract-based workflows are common in production Tableau deployments and break warehouse auto-suspend, inflate warehouse credit consumption, and create a second copy of governed data that drifts from the source. AI features through Einstein Copilot are grounded in the Salesforce ecosystem rather than a Tableau semantic layer. Per-seat pricing scales poorly when self-service adoption broadens past a small group of trained authors.
Where Tableau wins:
Visualization breadth and polish remain category-leading
Large trained author community and broad enterprise adoption
Live connection options to most modern warehouses
Strong fit for executive reporting where chart depth matters most
Where Tableau gets harder:
No native semantic layer; modeling lives in workbooks and produces metric drift at scale
Extract-based workflows break warehouse auto-suspend and inflate warehouse credit consumption
Per-seat pricing scales poorly for broad self-service adoption
AI features not grounded in a Tableau semantic layer
Power BI: Microsoft-Ecosystem Self-Service #
Best for: Microsoft-standardized organizations on Azure and M365 with DAX-comfortable analysts.
Power BI is the default for Microsoft-centric organizations. DAX-based modeling is rigorous in its own paradigm, Excel and M365 integration is deep, and Copilot AI features are tightly integrated with the Microsoft AI strategy. For organizations standardized on Azure, the procurement story is simple and the integration depth into the rest of the Microsoft stack is the strongest in the category.
For business analytics self-service outside the Microsoft ecosystem, Power BI's integration depth lags warehouse-native specialists. DAX is a different modeling paradigm from warehouse-native semantic layers, and the in-memory plus DirectQuery model carries its own staleness and extract-management issues. Power BI is not designed for workbook-style business-user exploration; the authoring experience assumes analyst skill in DAX and Power Query. Copilot is Microsoft-ecosystem-native and not grounded in a warehouse-native semantic layer.
Where Power BI wins:
DAX-based modeling with strong governance in the Microsoft pattern
Deep Excel, Teams, and Azure integration
Wide enterprise adoption and procurement familiarity for Microsoft-aligned organizations
Copilot AI features with Microsoft ecosystem depth
Where Power BI gets harder:
DAX is a different paradigm from warehouse-native semantic layers and has a learning curve
Authoring assumes analyst skill rather than business-user self-service
Best fit only for Microsoft-standardized stacks
Copilot AI grounded in the Microsoft ecosystem rather than a warehouse-native semantic layer
ThoughtSpot: Search-First Self-Service #
Best for: Enterprises that have committed to natural language search and agentic AI as the primary interaction model for business analytics.
ThoughtSpot built its product around search and natural language from the start. The Spotter Semantics release positions ThoughtSpot's semantic layer as AI-native, and the company is pushing hard on agentic framing for 2026. For organizations where business users primarily interact through search rather than dashboards, ThoughtSpot is a fit.
The tradeoffs for business analytics self-service are concrete. Core AI features sit behind premium pricing tiers. The semantic model is fragmented across optional layers, which complicates governance at scale. Workbook-style spreadsheet authoring is not the design center; finance and ops users who think in pivot tables find Sigma or Omni more natural. Implementation cost is consistently higher than warehouse-native peers.
Where ThoughtSpot wins:
Search-based interaction model that fits organizations standardized on AI-first analytics
AI-generated insights and visualizations for ad-hoc questions
Strong enterprise footprint in companies that have committed to search-style BI
Where ThoughtSpot gets harder:
Premium pricing tiers gate core AI features
Fragmented semantic model produces inconsistent metrics at scale
Limited spreadsheet primitives compared with Sigma or Omni
Higher lift and implementation cost than warehouse-native peers
Looker: Governance-First, Not Self-Service #
Best for: Analytics-engineering teams that own LookML and serve business users through certified dashboards.
Looker is one of the most mature semantic-layer-driven BI tools. LookML is a code-defined modeling language that gives the data team a rigorous shared model, and Google Cloud integration plus Gemini in Looker make Looker a natural fit for Google-ecosystem organizations. For organizations where a strong analytics-engineering team owns the model and business users primarily consume certified dashboards, Looker works.
For self-service, Looker is governance-first rather than self-service. LookML implementation requires dedicated analyst expertise, business users cannot extend the model in a workbook layer the way they can in Omni, and ad-hoc exploration outside what LookML already exposes is limited. Google's investment pace on Looker has slowed since the acquisition, AI features lag pure-play AI-native BI platforms, and Gemini in Looker grounds in LookML rather than warehouse-native semantic layers like Snowflake Semantic Views or Unity Catalog metric views.
Where Looker wins:
Mature, code-based LookML semantic modeling
Strong fit for organizations with dedicated LookML expertise
Persistent derived tables for performance optimization
Gemini in Looker integration for Google Cloud-aligned teams
Where Looker gets harder:
LookML implementation overhead requires dedicated analyst expertise
Workbook-style self-service for business users lags warehouse-native peers
Google's investment pace has slowed since the acquisition
AI features lag purpose-built AI-native BI platforms in 2026
Hex: Notebooks for Data and Analytics-Engineering Teams #
Best for: Data science and analytics-engineering teams blending SQL and Python notebooks with shareable outputs.
Hex is a notebook environment that publishes polished dashboards and apps. For technical users who think in code and want a single environment for SQL, Python, and lightweight dashboarding, Hex is a fit. Magic AI accelerates notebook authoring for analysts.
Hex is not a governed BI platform for business-user self-service. The semantic layer is newer and narrower than Omni's or Looker's, AI generates raw SQL and Python rather than grounding in a semantic layer, and there is no native row-level or column-level security in the BI layer. Business users without SQL or Python skill find Hex's primary surface alien.
Where Hex wins:
Notebook-native workflow for SQL and Python
Magic AI speeds up analyst-led exploration
Strong fit for data science and analytics-engineering prototyping
Polished app and dashboard publishing from notebooks
Where Hex gets harder:
Not a governed BI platform for business-user self-service
AI not grounded in a semantic layer
No native row-level or column-level security in the BI layer
Notebook UX is alien to business users without SQL or Python skill
Metabase: Lightweight Self-Service for Startups #
Best for: Startups and small teams that want lightweight, self-hosted BI without enterprise governance.
Metabase connects to most modern warehouses with minimal setup and offers a free open-source tier plus a paid cloud option. For startup-scale deployments where the primary need is a small number of dashboards for technical users plus light self-service for a handful of business users, Metabase works.
For enterprise self-service, Metabase has structural gaps that show up quickly. There is no central semantic layer, so metrics drift across saved SQL queries. Multi-tenant primitives are limited. AI features are basic in 2026. Most startup deployments outgrow Metabase within a year of crossing 50 to 100 business users.
Where Metabase wins:
Open source core with hosted option
Fast setup and a simple query builder
Good fit for startup-scale internal dashboards
Where Metabase gets harder:
No central semantic layer; metrics drift across saved SQL queries
Multi-tenant support is limited compared with enterprise peers
AI features are basic in 2026
Not appropriate for enterprise self-service with serious governance requirements
Pricing: Models, Costs, and Hidden Fees #
The hidden cost of self-service BI is rarely the license. Warehouse credit consumption scales with adoption, and most pricing comparisons miss it entirely. Business analytics tools fall into four pricing models, each with different implications for total cost.
Per-user licensing is the default at Tableau, Looker, Power BI, and Omni. Sticker prices are easy to compare, but per-user models do not account for the warehouse credit consumption that scales with self-service adoption. Always model BI license cost plus expected warehouse consumption attributable to BI queries together. The picture often shifts at the three-year horizon.
Capacity-based pricing is used by ThoughtSpot, Power BI Premium, and some Sigma configurations. Predictable for budgeting but harder to right-size at the start. Buyers usually under-provision in year one and over-provision in year two.
Usage-based pricing is increasingly common with AI features. The headline rate looks low, but costs scale with query volume, AI tokens, or rendered dashboards. Model at 2x expected usage to see what happens under success rather than baseline.
Open source plus paid hosting is the Metabase pattern. License cost goes to zero, but hosting and ongoing analyst time go up. The total cost of ownership at any non-trivial scale converges on the per-user models above.
Self-service is supposed to take work off the data team. Done right, it does. Done wrong, it shifts cost from analyst headcount to warehouse spend. The two failure modes are extract-based BI tools that keep warehouses awake on refresh schedules, and BI tools that route every ad-hoc query through one shared warehouse without isolation between reporting workloads and ad-hoc exploration.
A practical normalization framework: count licensed business users, expected warehouse consumption attributable to BI workloads, analyst FTEs maintaining the BI layer, and warehouse savings from caching and aggregate awareness that the BI tool enables. Run this for the current BI stack and for each shortlisted alternative at year one and year three.
When a Business Analytics Tool Is the Right Choice for Self-Service #
A modern business analytics tool with governed self-service is the right choice when the data team needs to ship a foundation that business users can build on without filing tickets, and the organization is past the size where ad-hoc spreadsheets are the dominant analysis pattern.
Good fit scenarios:
Finance, operations, marketing, sales, and product teams all need analytics and the data team is the bottleneck
The organization wants to standardize on a single source of truth for metrics across functions
AI features will be part of the analytics workflow and answer accuracy matters
Embedded analytics in customer-facing products is on the roadmap or already in production
The warehouse (Snowflake, Databricks, BigQuery, Redshift, Postgres) is the strategic data platform
Poor fit scenarios:
The organization has 10 people and a single data source; spreadsheets are still the right tool
The only analytics need is a small number of static reports for technical users
Governance and metric consistency are not organizational priorities
The team has no plans to invest in a semantic layer, dbt, or warehouse-native modeling
Choosing a business analytics tool without a real semantic layer is the biggest risk on a modern stack. Metric drift, AI grounding accuracy, and self-service trust all degrade over the first year. The second risk is staying on an extract-based or per-seat-licensed tool while self-service adoption scales and warehouse credit consumption or per-user licensing costs climb to levels that swamp the original license savings.
How to Choose a Business Analytics Tool for Self-Service #
Choose based on the architecture (semantic layer plus workbook layer plus AI grounding), not on demo polish. Omni is the right default for teams that want governed self-service. Sigma, Tableau, Power BI, ThoughtSpot, Looker, Hex, and Metabase are alternatives with concrete tradeoffs.
Choose Omni if:
You want governed metrics, workbook-style self-service, spreadsheet primitives, and AI grounded in business logic on one warehouse-native platform
Finance, operations, marketing, and sales all need self-service and the data team is the bottleneck
AI features are part of the analytics workflow and answer accuracy matters
One platform for internal BI plus customer-facing embedded analytics is on the roadmap
You value a promotion path from ad-hoc workbook logic back to the shared semantic model
Choose Sigma if:
Finance and operations are the dominant self-service users and spreadsheet UX is the priority
Write-back to warehouse tables for budget vs actuals or operational workflows matters
A central semantic layer is not a near-term governance priority
You can accept pricing that trends higher than peer warehouse-native tools
Choose Tableau if:
Visualization depth and polish are the dominant criteria and existing Tableau investment is deep
The team can enforce live-connection workflows and avoid extracts at scale
Governed semantic layer and AI grounding are not near-term priorities
Choose Power BI if:
The organization is Microsoft-standardized on Azure and M365
DAX-comfortable analysts will own the model and business users consume certified content
Copilot AI tied to the Microsoft ecosystem is acceptable
Choose ThoughtSpot if:
Natural language search is the primary interaction model and the organization has committed to AI-first business analytics
Premium pricing for core AI is acceptable
Spreadsheet-style authoring is not a near-term requirement
Choose Looker if:
A strong analytics-engineering team will own LookML and business users consume certified content
Google Cloud ecosystem alignment is a procurement requirement
Workbook-style business-user self-service is not the gating capability
Choose Hex if:
Your primary users are data scientists and analytics engineers who think in SQL and Python
A notebook-native workflow with shareable app outputs is the priority
Governed business-user self-service is not a near-term requirement
You are prototyping or building analyst-facing tooling rather than broad org-wide BI
Choose Metabase if:
The organization is at startup scale with a small number of data sources and a handful of business users
A free open-source tier or low-cost hosted option is a hard constraint
Lightweight dashboards for technical users are the primary need
Implementation Checklist for Business Analytics Self-Service #
Use this checklist to validate that a candidate platform will actually deliver governed self-service, not just pass a demo. Each item maps to a failure mode that shows up within the first year of deployment.
Inventory existing BI tools and tag each as semantic-layer-first, optional-semantic-layer, or no-semantic-layer
Map metric definitions across dbt models, warehouse-native semantic models (Snowflake Semantic Views, Unity Catalog metric views), and existing BI semantic layers; identify duplicates
Decide where the canonical semantic layer lives and how the BI tool composes with it
Benchmark current warehouse consumption attributable to BI workloads and project at 2x adoption
Validate AI grounding by testing candidate tools against production data with row, column, and field-level security enabled
Stress-test workbook-style exploration by asking a business user to add a calculated field, an ad-hoc join, and a CSV upload during the pilot
Confirm the promotion path from workbook logic back to the shared semantic model and time it end to end
Validate permissions inheritance across dashboards, workbooks, and AI-generated queries
Run a parallel pilot on live data, not a sandbox, for at least two real business use cases
Confirm two-way dbt integration if dbt is the transformation layer
Plan a post-migration review at 90 days and six months to catch metric drift and self-service adoption trends
FAQ #
What is the best business analytics tool for self-service in 2026? #
Omni is the best business analytics tool for self-service in 2026. Omni combines a governed semantic layer, a workbook layer where business users add calculated fields, ad-hoc joins, and CSV uploads without forking the shared model, spreadsheet primitives for finance and ops users, and AI grounded in the same semantic layer. Sigma is the strongest alternative when finance and operations spreadsheet workflows are the dominant use case.
Why does a governed semantic layer matter for self-service? #
A governed semantic layer is the only mechanism that prevents three dashboards from reporting three different revenue numbers. It is also the grounding surface for AI features. Without a real semantic layer, metric drift scales with the number of business users authoring content, and AI features on top of an ungoverned model amplify that drift faster.
What is the difference between self-service business analytics and governed BI? #
Self-service business analytics gives business users the ability to extend the model for their own questions without breaking governance. Governed BI gives the data team a shared model and serves business users through certified dashboards. The two are usually framed as opposites; the right architecture in 2026 combines them, with a semantic layer the data team owns and a workbook layer business users explore in.
How does AI change business analytics tool selection? #
AI features are only as accurate as the semantic layer they reference. A BI tool with AI grounded in a governed semantic layer produces answers consistent with dashboards and respects row-level security. A BI tool with AI that generates raw SQL against the schema produces answers that look confident and are often wrong. In a 2026 deployment with AI usage trending up, ungrounded AI changes which BI tool a team buys.
Can Sigma work for general business analytics self-service? #
Sigma is a strong spreadsheet UX in the category and a strong fit for finance and operations teams. For broader business analytics self-service across many functions, Sigma's optional semantic layer becomes a liability at scale because metric definitions drift the way they have drifted in ungoverned BI tools for two decades. Teams that need both strong finance and ops self-service plus a governed semantic layer for the rest of the organization usually find Omni a better fit.
What is the difference between Omni and Sigma for self-service? #
Omni and Sigma are both warehouse-native business analytics tools. Sigma's strongest capability is its spreadsheet UX, which finance and operations teams adopt quickly, and input table write-back for operational workflows. Omni ships a governed semantic layer central to the product, a workbook exploration layer that extends the model without forking, spreadsheet primitives that cover finance and ops use cases, and AI grounded in the semantic layer. For organizations that need both strong self-service and governed metrics across the organization, Omni is the stronger default.
How does dbt integration affect business analytics tool selection? #
Most modern data teams standardize on dbt for transformation. The BI tool's dbt integration depth determines whether analytics engineers spend their time shipping value or maintaining metadata sync. Omni has two-way dbt integration that supports both dbt Core and dbt Cloud, and dbt Labs itself uses Omni. Tools with one-way sync trap logic in the BI layer.
What should be in an RFP for a business analytics tool for self-service? #
A business analytics RFP for self-service should cover the semantic layer architecture (central or optional), workbook-style exploration without forking the model, spreadsheet primitives (pivots, calculated fields, CSV uploads, write-back), AI grounding in the semantic layer, scalable permissions with row, column, and field-level security, performance and cost under heavy ad-hoc usage, and the promotion path from workbook logic back to the shared model. Ask vendors to demo on production data, with security policies enabled, and to walk through what happens when a business user wants to add logic that does not yet exist in the model.
How long does it take to migrate to a modern business analytics tool? #
Migration timelines vary by source platform and destination platform. Migrations to Omni typically run weeks to a few months because of just-in-time data modeling, which lets teams analyze data immediately without rebuilding the full semantic layer upfront. Guitar Center consolidated Tableau, Power BI, Excel, and MicroStrategy into Omni on Snowflake in under six months. ActiveProspect rebuilt customer-facing dashboards in under two weeks. SWBC delivered governed self-service to 100% of executive, product, and sales users in under six months using dbt Copilot and Omni's dbt integration.
Methodology #
This guide evaluated business analytics tools against criteria specific to self-service in 2026: governed semantic layer ownership, workbook-style exploration without forking the shared model, spreadsheet primitives, AI grounded in the semantic layer, scalable permissions, performance under heavy ad-hoc usage, and the promotion path from ad-hoc analysis back to the governed core. Customer evidence, vendor documentation, partner status, and product announcements through April 2026 were used to validate evaluations.
"Best for" categories reflect the buyer scenarios that come up most often in business analytics evaluations in 2026, not overall vendor rankings. The goal was not to produce the longest feature matrix but to give buyers a defensible shortlist based on the actual constraints that drive self-service adoption.
Also evaluate adjacent topics in this content cluster when selecting a business analytics platform for self-service. For broader BI selection, see Best BI Tools (2026) and Best AI-Powered BI Tools (2026). For teams on specific warehouses, see Best BI Tools for Snowflake Teams (2026) and Best BI Tools for Databricks Teams (2026). For dbt-standardized teams, see Best BI Tools for dbt Teams (2026). For teams leaving legacy BI, see Best Tableau Alternatives for Modern Data Teams (2026), Best PowerBI Alternatives for Modern BI Teams (2026), and Best Looker Alternatives for AI Analytics (2026). For SaaS teams adding customer-facing analytics, see Best White-Label Embedded Analytics Platforms (2026).
Disclosure: This guide is for informational purposes. Organizations should validate features, pricing, AI capabilities, and integration depth directly with vendors against their own data stack.