Embedded analytics that work fine in a demo, or with the first dozen customers, routinely break down once tenant count and data volume actually grow. It shows up as dashboard load times that creep upward month over month, concurrent query limits on the warehouse getting hit during peak usage, and query costs climbing faster than revenue. None of this is a vendor-shopping problem in the sense of picking the tool with the longest feature list. It’s an architecture problem, and the architecture decisions that determine the outcome get made, or defaulted into, before most teams realize they're making them.
The pattern is consistent. A platform team ships embedded analytics against a handful of pilot customers. The queries are fast because the data is small and nobody is querying concurrently. Six months and two hundred tenants later, the same dashboards are slow, the warehouse is throttling concurrent queries during business hours, and the monthly warehouse bill has become a line item someone has to explain. The underlying cause is almost never "the BI tool is bad." It is that the caching strategy, the query architecture, and the data modeling approach that worked at low scale do not hold at high scale, and nobody re-architected before the cracks showed.
This piece is a technical deep dive into the architecture patterns that determine whether embedded analytics scale inside a multi-tenant SaaS product: caching and pre-aggregation, the tradeoff between query federation and data extraction, warehouse-native query pushdown, and the role a governed semantic layer plays in keeping all of it tractable as tenant count grows. It‘s written for platform engineering leads architecting or re-architecting an embedded analytics layer. For row-level security and multi-tenant compliance architecture specifically, see the companion guide on row-level security for embedded analytics and BI; this piece focuses on performance and cost architecture instead.
TL;DR #
Embedded analytics scale when three architectural decisions are made deliberately: a caching strategy with more than one layer (result caching plus pre-aggregation), a query architecture that avoids maintaining a second, duplicated copy of tenant data, and a governed semantic layer that defines metrics and joins once so scaling tenant count doesn't mean re-solving the same query logic per customer. Omni's architecture combines a multi-layer intelligent cache, aggregate awareness that automatically routes queries to pre-aggregated tables, and a governed semantic layer that’s been production load-tested to support BambooHR's rollout to 100,000+ end users and demonstrated against a live 3.65 billion row dataset returning results in 3.8 seconds.
What Teams Get Wrong About Scaling Embedded Analytics #
Most teams design an embedding approach and a data architecture that work for the tenant count and data volume they have today, then treat performance at 10x that scale as a problem to solve later. That "later" arrives faster than expected, because tenant count and data volume in embedded analytics tend to grow together: more customers means more data per customer and more concurrent dashboard sessions during the same business hours.
The common mistake is architecting for correctness and features first, only to discover the performance ceiling once real customer usage hits it. A dashboard that returns correct numbers for one tenant querying alone says nothing about what happens when five hundred tenants query the same underlying model concurrently during a Monday morning login rush. Caching strategy, query architecture, and warehouse concurrency management are the three decisions that behave completely differently at 10 tenants versus 1,000, and they’re usually the three decisions nobody revisits until a customer complains about a slow dashboard or finance flags a warehouse bill that doubled without a matching jump in revenue.
The actual decision criteria are not "does this dashboard load fast right now" but: what happens to load time, warehouse concurrency, and cost as tenant count and data volume grow by an order of magnitude, and does answering that question require re-architecting or just adding capacity.
The Architecture Patterns That Determine Whether Embedded Analytics Scales #
Four architectural decisions determine whether embedded analytics holds up as usage grows: caching depth, the query federation versus extraction tradeoff, warehouse-native query pushdown, and whether a governed semantic layer sits underneath all of it.
Caching strategies, and where each one breaks down #
Caching in embedded analytics operates at more than one layer, and conflating them is where most performance planning goes wrong. Result caching stores the output of an exact-match query so a second user asking the same question doesn’t re-trigger a warehouse query. Omni's query cache works this way by default, caching results for six hours and sharing them across users with matching permissions on the same data set. This layer breaks down the moment queries vary even slightly, since it typically requires an exact match on fields, filters, pivots, and sorts.
A second caching layer, often overlooked, caches data for requery rather than just exact repeats. Omni's requeryable cache holds a session's last query results in the browser, so filtering, re-sorting, or regrouping the same underlying data set happens in memory instead of round-tripping to the warehouse. Building dashboards so that filter permutations are pre-loaded into this cache, sometimes described as building a "cube" of every filter combination, can turn a dashboard that would otherwise fire a new warehouse query per filter click into one that responds instantly after the first load. This layer breaks down when the data volume behind a dashboard exceeds what is practical to hold in a browser session.
Pre-aggregation is the third layer, and it actually reduces warehouse load rather than just avoiding redundant round trips. Omni's aggregate awareness automatically rewrites a query to hit a smaller, pre-aggregated rollup table instead of the full granular table whenever the rollup contains everything the query needs, with no end-user action required. This layer breaks down when a query asks for a grain, field, or join key the aggregate table doesn’t contain, since Omni (like any aggregate-aware system) falls back to the base table rather than returning wrong results.
The failure mode is treating caching as one setting instead of three layers with different breakage conditions. A dashboard that only has exact-match result caching will still slow down the moment tenants start applying different filters, which they will.
Query federation versus data extraction as tenant count grows #
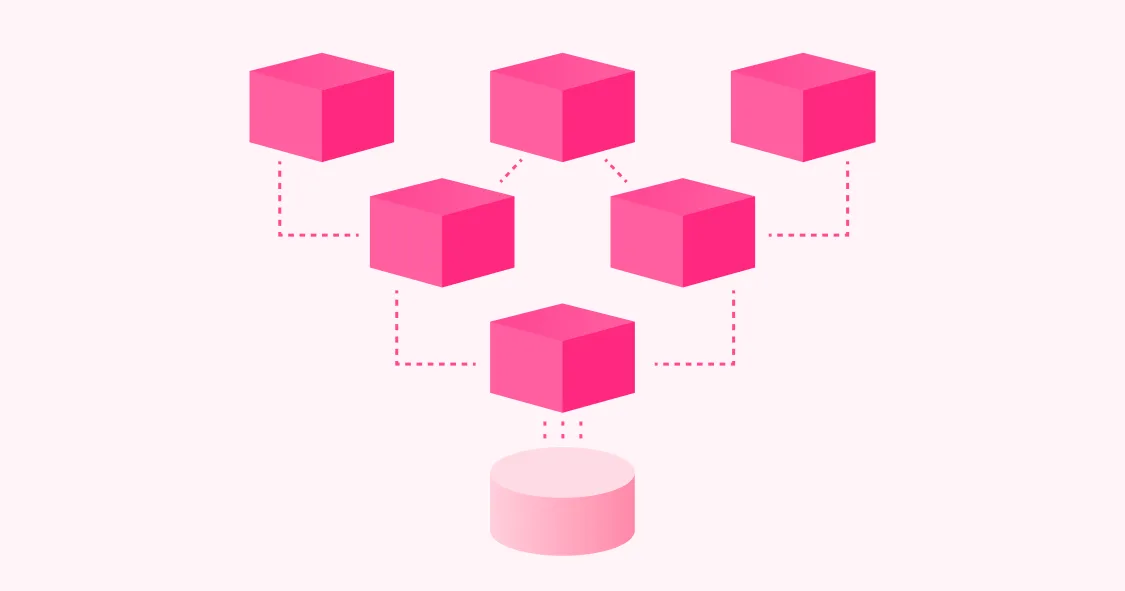
Every embedded analytics architecture eventually answers one question: does the platform query the customer's warehouse directly (query federation, also called warehouse-native or live query), or does it copy tenant data into a second, vendor-managed store (data extraction)? The tradeoff changes character as tenant count grows.
At low tenant count, extraction can feel faster to ship: a smaller in-memory or cached copy of the data can outperform a live warehouse round trip for simple dashboards. The cost shows up later. Extraction requires a refresh schedule, which means embedded dashboards can lag behind the source data by minutes or hours, and it requires maintaining a second copy of every tenant's data outside the warehouse's security boundary, which duplicates both storage cost and the row-level security logic that has to be kept in sync with the source. As tenant count grows, keeping dozens or hundreds of extracts fresh, correctly scoped, and consistent with the warehouse becomes its own ongoing engineering project that scales with tenant count.
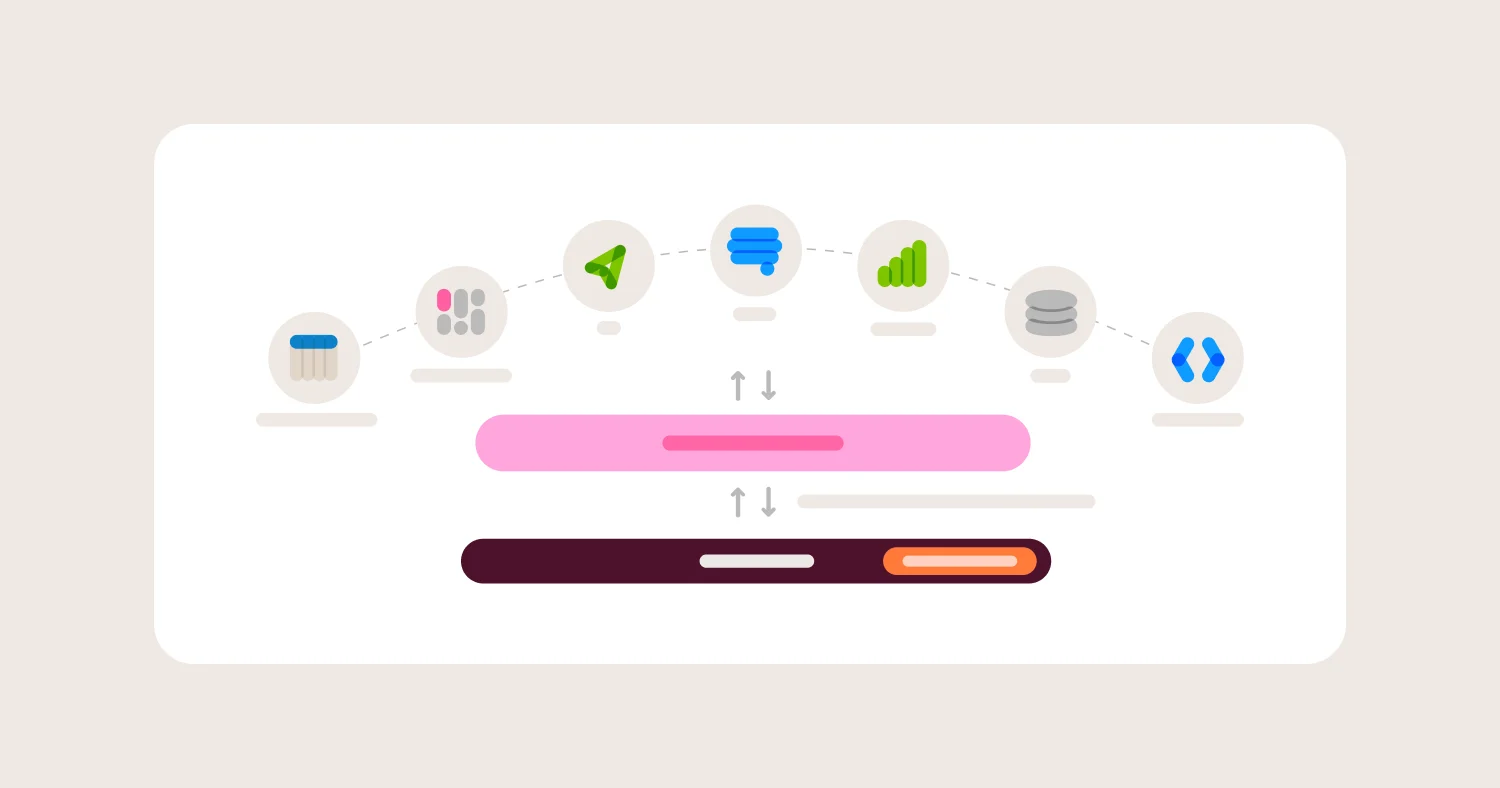
Query federation avoids the duplication by generating SQL and running it directly against the customer's warehouse for every request. This keeps data fresh and keeps tenant data inside the warehouse's existing security perimeter, but it means warehouse compute cost and concurrency scale directly with query volume, which is exactly why the caching layers above matter so much for a warehouse-native architecture specifically. Omni's architecture is warehouse-native by default and does not store customer data; it generates SQL and queries the connected warehouse, then layers caching on top to control the cost and latency that a pure live-query approach would otherwise incur at scale. Other warehouse-native platforms make the same structural bet: Sigma connects directly to the cloud data warehouse rather than maintaining a separate store, and Astrato's architecture queries Snowflake, BigQuery, Databricks, and similar warehouses live on every interaction rather than extracting on a reload schedule.
The practical takeaway for a platform team choosing between the two: extraction can look faster in a proof of concept and gets more expensive to operate correctly as tenant count grows, while query federation requires investing in caching and pre-aggregation up front but does not require re-architecting data pipelines every time tenant count doubles.
Warehouse-native query pushdown #
Query pushdown means compiling as much of the query logic (filtering, aggregation, joins) into the SQL sent to the warehouse, rather than pulling raw rows into an application layer and computing the result there. This matters for scale specifically because it means the platform's own infrastructure does not need to grow in proportion to data volume. Omni's own benchmark against a 3.65 billion row Snowflake dataset demonstrates the pattern directly: the warehouse scanned every one of the 3,654,795,534 rows and returned an aggregated result in 3.8 seconds, because the aggregation itself ran inside Snowflake rather than in Omni's application layer. The same pattern, pushing computation down to the warehouse so that performance on large or growing datasets scales with warehouse compute rather than with the analytics vendor's own infrastructure, is the architectural bet Astrato and Sigma make as well.
Pushdown avoids a specific re-architecting trap: platforms that pull data into their own compute layer to process it eventually hit a ceiling where that layer has to be scaled, sharded, or replaced as data volume grows, an unplanned re-architecture most teams don't budget for. Pushdown defers that scaling problem to the warehouse, which cloud warehouses like Snowflake, BigQuery, and Databricks are already built to scale elastically.
Why a governed semantic layer keeps this tractable at scale #
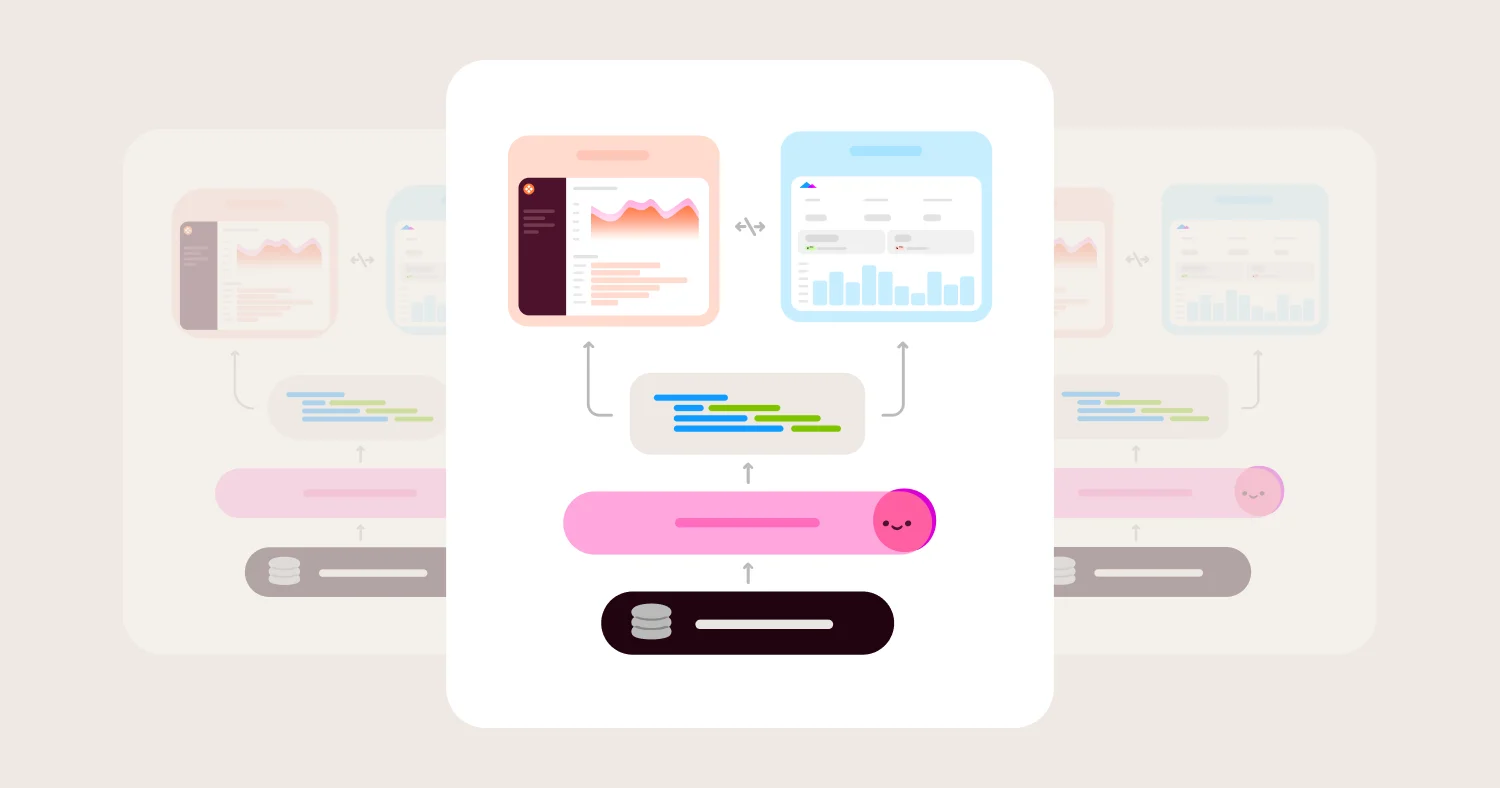
A semantic layer defines metrics, dimensions, and joins once, in a single modeled location, rather than letting each dashboard, each tenant view, or each analyst re-derive the same logic independently. For multi-tenant embedded analytics specifically, this matters because it is the mechanism that keeps adding the 500th tenant as cheap, architecturally, as adding the 5th. Without a shared semantic layer, teams tend to accumulate slightly different versions of the same query logic per tenant or per dashboard, each one an independent thing to optimize, cache, and debug separately.
BambooHR's engineering team described this directly in scaling their embedded Elite Analytics tier to more than 100,000 people: Omni's semantic layer let their product and data teams "define metrics once, then reuse and maintain them across all customers," and their model extension API let them layer tenant-specific custom fields onto that shared model programmatically, rather than hand-building a new model per customer. A governed semantic layer also means the caching and pre-aggregation strategies described above only need to be designed once, against the model, instead of once per tenant dashboard. Omni's shared extension models formalize this pattern, letting each tenant inherit core query logic while layering in customization, without forking the underlying model per customer.
Where Embedded Analytics Breaks in Production #
Three bottlenecks account for most of the production performance problems teams hit as embedded analytics scales: creeping dashboard load times, warehouse concurrency limits, and query costs that climb faster than tenant count.
Dashboard load time creeping up as tenants are added #
This happens gradually enough that it is easy to miss until customers start noticing. Each additional tenant adds new query patterns, new filter combinations, and new data volume against the same shared model. If caching is only configured as a simple exact-match layer, the cache hit rate falls as the variety of queries grows, and more requests fall through to the warehouse. The architectural fix is layering caching deliberately rather than relying on a single setting: combining exact-match result caching with a requeryable, in-browser cache built around a dashboard's actual filter permutations, and warming caches proactively via a schedule before real users hit a cold dashboard for the first time each day. Omni's cache warming pattern, where a scheduled run refreshes the cache ahead of expected traffic, exists specifically to prevent the first user of the day from experiencing the slow, cold-cache load.
Concurrent query limits on the underlying warehouse #
Cloud warehouses queue or throttle queries beyond a given concurrency threshold, and a warehouse-native embedded analytics architecture sends real query load to the warehouse for every uncached request. As dashboards get embedded in front of thousands of end users, simultaneous logins, a common pattern at the start of a business day, can generate a concurrency spike that competes for the same compute even when tenant data is logically isolated: a noisy-neighbor problem where one tenant's heavy query degrades response times for every other tenant sharing the same compute. The architectural fix combines several of the patterns above: aggregate awareness to route as many queries as possible to smaller pre-aggregated tables instead of the full granular table, caching to absorb repeat and near-repeat queries before they reach the warehouse at all, and, for the highest-usage tenants or tiers, dedicated warehouse compute (a separate virtual warehouse or cluster) so one tenant's load spike cannot degrade another's experience.
Surprise cost increases from redundant or unoptimized queries #
Warehouse compute cost in a query-federation architecture scales with query volume, and redundant, unoptimized queries are the most common way that cost outpaces tenant growth. This shows up when dashboards are built independently per tenant rather than against a shared semantic layer, since near-identical queries with slightly different SQL each miss any shared result cache and hit the warehouse separately, and it shows up when aggregate awareness or pre-aggregation isn't configured, so every query, including ones that only need a coarse daily rollup, scans full granular tables. The architectural fix is the same governed semantic layer and aggregate awareness pattern described above: a single modeled definition of a metric means one cached or pre-aggregated result can serve every tenant's version of "what happened yesterday," instead of each tenant's dashboard independently re-scanning the base table.
How to Evaluate an Embedded Analytics Vendor Specifically for Scale #
Evaluate an embedded analytics vendor for scale by asking about caching depth, query architecture, pre-aggregation support, concurrency isolation, load testing rigor, and cost predictability, not by asking whether a demo dashboard loads quickly with a handful of test rows.
1) Caching architecture depth #
What it is: Whether the platform offers a single exact-match cache, or a layered approach combining result caching, in-session requery caching, and pre-aggregation.
Why it matters: A single-layer cache degrades quickly as query variety grows with tenant count; a layered approach absorbs far more real-world query variation before falling through to the warehouse.
What to ask vendors: What are the distinct caching layers, and what specifically causes each one to miss? Can cache duration and cache-busting be configured per model or per piece of content, or is it a single global setting?
What usually goes wrong: Teams confirm a cache exists in the demo and never test what happens to hit rate once real tenants start applying dozens of different filter combinations.
2) Query architecture: federation versus extraction #
What it is: Whether the platform queries the warehouse live for every request, or maintains a separate, periodically refreshed copy of tenant data.
Why it matters: Extraction requires ongoing pipeline maintenance that scales with tenant count and introduces data freshness lag; query federation avoids the duplication but requires caching and pre-aggregation to control cost and latency at scale.
What to ask vendors: Does this platform store a copy of our data, or does it query our warehouse directly for every request? If it stores a copy, what is the refresh cadence, and how is that copy kept in sync with row-level security rules defined in the warehouse or the model?
What usually goes wrong: Teams evaluate freshness and setup speed in a proof of concept without asking what happens to pipeline maintenance overhead once there are 200 tenant-specific extracts to keep synchronized instead of 5.
3) Pre-aggregation and aggregate awareness #
What it is: Whether the platform can automatically route a query to a smaller, pre-aggregated table when one exists, without requiring the end user to know or choose.
Why it matters: Pre-aggregation is the single biggest lever for reducing both query latency and warehouse compute cost on large or fast-growing datasets, because it avoids re-scanning full granular tables for queries that only need a coarser grain.
What to ask vendors: Is aggregate table routing automatic, or does an end user or developer need to manually pick which table to query? What happens when a query needs a field the aggregate table doesn't have; does it silently return wrong results, or does it fall back safely to the base table?
What usually goes wrong: Teams build pre-aggregated tables in dbt or a transformation layer and never verify that the BI layer is actually routing to them, so the pre-aggregation work delivers no performance benefit.
4) Concurrency and noisy-neighbor isolation #
What it is: How the platform, or the underlying warehouse, prevents one tenant's heavy or inefficient query from degrading response times for every other tenant.
Why it matters: Multi-tenant embedded analytics concentrates concurrent usage in predictable spikes (business-day logins, month-end reporting), and shared compute without isolation means those spikes cause cross-tenant performance degradation.
What to ask vendors: What happens to other tenants' dashboards when one tenant runs an expensive, unoptimized query? Is dedicated compute per tenant or tenant tier available, and at what point in scaling does a team typically need it?
What usually goes wrong: Teams don't notice noisy-neighbor effects until a single enterprise customer's heavy usage starts generating support tickets from every other tenant on the same shared compute.
5) Load testing rigor and transparency #
What it is: Whether a vendor can describe, with specifics, how they test their own platform's performance under realistic concurrent load, and share what they've learned from doing it.
Why it matters: A vendor that has done rigorous load testing on their own infrastructure, and can describe genuine bottlenecks they found and fixed, is a much stronger signal than a vendor that only demonstrates performance on a small, low-concurrency dataset.
What to ask vendors: Can you describe your own load testing methodology and share concrete findings, not just conclusions? Have you load-tested a scenario resembling our tenant count and query concurrency specifically?
What usually goes wrong: Teams accept "yes, we're built for scale" as an answer without asking for the specific methodology or evidence behind the claim. Omni has published its own load testing methodology in detail, including bottlenecks found (a database connection library, not the database itself, was a root cause in one case) and how they were diagnosed.
6) Cost model transparency at scale #
What it is: How clearly a vendor can explain what happens to warehouse compute cost and platform licensing cost as tenant count and query volume grow.
Why it matters: Query-federation architectures shift cost onto warehouse compute, which is usage-based and can grow unpredictably without caching and pre-aggregation to control it; extraction architectures shift cost onto storage and pipeline maintenance instead.
What to ask vendors: Walk through, concretely, what happens to our cost (warehouse compute, platform licensing, or both) if tenant count grows 10x with proportional data volume. What levers do we have to control that cost besides just paying for more warehouse compute?
What usually goes wrong: Teams model cost based on current usage and don't ask the vendor to walk through the cost curve at 10x scale, which is exactly where caching and pre-aggregation choices start to matter financially, not just for latency.
Comparison Matrix (2026): Architecture for Scale #
Embeddable, Sigma, and Astrato each publish dedicated content on scaling embedded analytics, and each makes a version of the same core architectural bet: query the warehouse directly rather than extracting data, and let warehouse compute absorb the scaling burden. The differentiator across all four platforms below, including Omni, is how much of the caching and pre-aggregation work happens automatically versus how much a team has to build and manage themselves as usage grows.
Vendor | Best for | Caching / pre-aggregation approach | Query architecture | Concurrency handling at scale | Main tradeoff |
Omni | Teams that want automatic, multi-layer caching and pre-aggregation built into a governed semantic layer | Multi-layer intelligent cache (exact-match result cache, in-browser requeryable cache) plus automatic aggregate awareness that routes queries to pre-aggregated tables | Warehouse-native; generates SQL and queries the connected warehouse directly, no stored copy of tenant data | Caching and aggregate awareness absorb most repeat and near-repeat query load before it reaches the warehouse; dedicated compute available for high-usage tenants | Aggregate awareness requires building and mapping rollup tables in a transformation layer; not a zero-configuration feature |
Sigma | Teams standardizing on warehouse-native architecture with a spreadsheet-style UX for embedding | Sigma documents materializations and warehouse-side performance controls, but its public architecture does not describe Omni's combination of exact-match result caching, requeryable in-browser caching, and automatic rollup routing. | Warehouse-native; connects directly to the cloud data warehouse for live queries | Performance and cost scale with warehouse compute; noisy-neighbor mitigation depends on warehouse-side workload management | Cost and concurrency management rely more heavily on warehouse-side controls than on a dedicated caching layer |
Astrato | Teams needing live-query embedding across a wide range of warehouses (Snowflake, BigQuery, Databricks, ClickHouse, Redshift, Postgres) | Live-query architecture with warehouse-inherited security; public content does not detail a separate pre-aggregation or multi-layer cache system | Warehouse-native; queries the warehouse directly on every interaction, explicitly avoiding extracts or a secondary data copy | Performance scales with warehouse compute by design; concurrency isolation depends on the underlying warehouse's own workload management | Like Sigma, cost and concurrency scale directly with warehouse compute rather than being absorbed by a dedicated cache layer first |
Embeddable | Developer-first teams that want a semantic layer plus an explicit multi-layer cache without copying tenant data | Explicit L1 in-memory cache for hot queries, L2 pre-aggregations for large datasets, and a caching API for orchestrating refresh and invalidation | Warehouse-native; connects to the data source without copying underlying customer data into a separate analytics store | Multi-tenant architecture built in from the start, with caching layers designed specifically to reduce redundant warehouse hits | Embeds as HTML web components rather than iframes, a different integration model that may require more front-end integration work |
Detailed Architecture Profiles #
Omni #
Best for: Platform teams that want automatic caching and pre-aggregation handled by the platform, backed by published, quantified evidence of performance at scale.
Omni's architecture combines three things that matter specifically for multi-tenant scale: a warehouse-native query model that never stores a copy of tenant data, a multi-layer intelligent cache that automatically decides whether to serve a query from the browser, an application-layer cache, or the warehouse itself, and aggregate awareness that automatically rewrites queries to hit pre-aggregated rollup tables when one covers the request. All three sit on top of a governed semantic layer, so the caching and pre-aggregation strategy is defined once against the model rather than once per tenant dashboard.
The evidence for this at scale is unusually concrete for the category. Omni's own engineering team publishes its load testing methodology in detail, including specific bottlenecks discovered (a database connection library, not the database itself) and how they were diagnosed under simulated concurrent load. In production, BambooHR worked directly with Omni's engineering team on load testing before launching its Elite Analytics tier to 30,000 people, a rollout that has since grown past 100,000 people, with field-level security enforced without sacrificing performance. Guitar Center consolidated multiple BI tools onto Omni to give thousands of users governed access on a single platform. In a direct benchmark, Omni returned an aggregated result from a live 3.65 billion row Snowflake dataset in 3.8 seconds with no pre-aggregation and a cold cache.
The tradeoff is that aggregate awareness is not a zero-configuration feature: it requires building rollup tables in a transformation layer like dbt and explicitly mapping them to the base view with a materialized_query parameter. Teams that want performance gains from pre-aggregation need to do that modeling work; it does not happen automatically without it.
Sigma #
Best for: Teams standardizing on a warehouse-native architecture who want a spreadsheet-style UX for embedding and are comfortable relying primarily on warehouse-side performance controls.
Sigma's own published guidance on scaling embedded analytics centers on one architectural principle: query the cloud data warehouse directly rather than maintaining a separate data store, so that scaling usage does not require multiplying data pipelines or re-architecting security logic. This is a legitimate and defensible architectural bet, and it matches the warehouse-native pattern this piece recommends over extraction.
Where Sigma's public content is less specific is on the caching and pre-aggregation layer that sits between the application and the warehouse. The architecture emphasizes live queries and centralized governance at the source; it does not publicly detail a distinct multi-layer caching or automatic pre-aggregation system comparable to aggregate awareness. For teams evaluating Sigma specifically for high-concurrency, multi-tenant scale, that detail is worth asking about directly, since warehouse-native live queries without a dedicated caching layer means cost and concurrency management fall more heavily on warehouse-side workload controls.
Astrato #
Best for: Teams that need live-query embedding across a particularly wide range of warehouses and want to inherit the warehouse's own security model directly rather than maintaining a parallel one.
Astrato's architecture is explicitly live-query: it connects directly to Snowflake, BigQuery, Databricks, ClickHouse, Redshift, and PostgreSQL, and queries them on every interaction rather than extracting data on a reload schedule. This avoids the freshness lag and data duplication that extraction-based tools carry, and it means Astrato inherits the warehouse's own security model, including row-level permissions, rather than rebuilding that logic at the application layer.
The tradeoff mirrors Sigma's: because performance is designed to scale with warehouse compute directly, published architecture content does not detail a separate pre-aggregation or multi-layer caching system positioned between the application and the warehouse. For very high-concurrency, multi-tenant embedded deployments, that means cost and concurrency management depend more on warehouse-side workload isolation (separate virtual warehouses or compute clusters per tenant tier) than on an intermediate caching layer absorbing load before it reaches the warehouse.
Embeddable #
Best for: Developer-first teams that want an explicit, documented multi-layer caching architecture without copying tenant data out of the source system.
Embeddable's architecture is close to Omni's in structure: it does not copy underlying customer data into a separate analytics store, defines data models in a semantic layer with pre-defined ways of slicing data, and layers caching explicitly, with a published L1 in-memory cache for hot queries, L2 pre-aggregations for larger datasets, and a caching API for orchestrating refresh and invalidation rules. This is a genuinely comparable approach to the multi-layer caching pattern this piece recommends, and Embeddable's own content on multi-tenant dashboards addresses security and scale together rather than treating them as separate concerns.
The structural difference is the embedding method: Embeddable renders dashboards as native HTML web components rather than iframes, which can integrate more tightly with a product's existing design system but is a different integration model that front-end teams should evaluate directly against their own stack, rather than assuming iframe-based integration patterns will carry over.
Cost at Scale: Where the Money Actually Goes #
Cost in embedded analytics at scale concentrates in three places: warehouse compute for live queries, storage and pipeline maintenance for any extracted or duplicated data, and the engineering time spent re-architecting caching or pre-aggregation after a performance problem has already reached customers.
Warehouse compute cost is the most direct and the most controllable, precisely because caching and pre-aggregation exist specifically to reduce it. A query-federation architecture without meaningful caching or aggregate awareness will show cost scaling roughly linearly with query volume; the same architecture with both will show cost growing much closer to tenant and data growth rather than raw query count, because repeat and near-repeat queries stop generating new warehouse compute. This is the direct financial argument for treating caching depth and aggregate awareness as scale requirements, not nice-to-haves, from the start of an embedded analytics build.
Extraction-based architectures shift some of that compute cost into storage and pipeline engineering instead, and that cost is easy to underestimate because it shows up as engineering time rather than a warehouse invoice line item: keeping tenant extracts fresh, correctly scoped to row-level security rules, and consistent with schema changes in the source system is ongoing work that scales with tenant count, not a one-time setup cost.
The largest and least predictable cost is reactive re-architecture: rebuilding a caching strategy, adding pre-aggregation, or splitting shared compute into per-tenant isolation after a performance or cost problem has already surfaced in production, under time pressure, with customers already affected. This is the cost this entire piece is written to help teams avoid, by making the caching, query architecture, and semantic layer decisions deliberately before scale forces the issue.
When Each Architecture Pattern Is the Right Choice #
Good fit for a warehouse-native, cache-and-pre-aggregate architecture:
Multi-tenant embedded analytics products where tenant count and data volume are both expected to grow significantly.
Products where dashboard freshness (near-real-time data) is a real customer requirement, not a nice-to-have.
Teams with the modeling capacity to define a governed semantic layer and build pre-aggregated tables for the highest-traffic queries.
Good fit for extraction, at least initially:
Early-stage products with a small, stable tenant count where warehouse access, cost, or latency from the customer's own infrastructure is a genuine constraint.
Scenarios where near-real-time freshness is not required and a scheduled refresh (hourly or daily) is acceptable.
Not a fit for either without caching investment:
Any embedded analytics product expecting high concurrent usage (thousands of simultaneous dashboard sessions) without a layered caching and pre-aggregation strategy in place; this is the combination that produces the load-time, concurrency, and cost bottlenecks described earlier, regardless of which query architecture underlies it.
How to Choose an Architecture for Your Scale Trajectory #
Choose an architecture based on where tenant count and data volume are headed over the next 12 to 24 months, not where they are today, since re-architecting caching or query strategy under production load is far more expensive than building it in from the start.
Choose a warehouse-native architecture with automatic caching and pre-aggregation (Omni) if:
You want caching, requeryable browser caching, and pre-aggregation routing handled by the platform rather than hand-built.
You need evidence of production performance at real scale (billions of rows, hundreds of thousands of end users) before committing.
Your team has the modeling capacity to define a governed semantic layer and is willing to invest in pre-aggregation modeling for the highest-traffic queries.
Choose a warehouse-native architecture with less publicly detailed caching (Sigma or Astrato) if:
Your organization already has strong warehouse-side workload management (dedicated virtual warehouses, admission control) and is comfortable relying on it for concurrency isolation.
A spreadsheet-style UX (Sigma) or breadth of supported warehouses beyond the major three (Astrato) is the deciding product requirement.
Choose a developer-first, explicit multi-layer caching architecture (Embeddable) if:
Your team wants a documented L1/L2 caching model and prefers native web-component embedding over iframes.
You are building analytics deeply integrated into your product's own front-end rather than embedding a more self-contained dashboard experience.
Implementation Checklist #
Model expected tenant count and data volume 12 to 24 months out, not just at launch, before choosing between query federation and extraction.
Treat caching as at least two layers (exact-match result cache and in-session requery cache), not one setting.
Identify your highest-traffic queries and build pre-aggregated rollup tables for them before they become a production bottleneck.
Verify pre-aggregation is actually being used by inspecting generated SQL, not by assuming it is working because a rollup table exists.
Warm caches proactively ahead of predictable usage spikes (start of business day, month-end reporting) rather than letting the first user each day hit a cold cache.
Load-test with realistic query variety, not identical repeated queries, since identical queries produce artificially high cache-hit rates that won't reflect production traffic.
Test concurrency at the tenant level specifically: simulate many tenants querying simultaneously, not one tenant querying repeatedly.
Confirm whether high-usage tenants can be isolated onto dedicated warehouse compute before a single tenant's usage becomes a noisy-neighbor problem for everyone else.
Model warehouse compute cost at 10x current query volume before committing to a query-federation architecture without caching in place.
Re-audit performance architecture any time a major new tenant, tenant tier, or data volume increase is onboarded, rather than waiting for a complaint.
FAQ #
What causes embedded analytics to slow down as tenant count grows? #
Embedded analytics slows down as tenant count grows primarily because caching hit rates fall as query variety increases, and because more tenants querying concurrently compete for the same warehouse compute if there is no dedicated capacity or workload isolation. Both causes are architectural, not caused by any single slow query, and both are addressed by layered caching, pre-aggregation, and warehouse concurrency management rather than by optimizing individual dashboards.
Should embedded analytics use query federation or data extraction? #
Query federation (querying the warehouse live) avoids the data duplication, freshness lag, and per-tenant pipeline maintenance that data extraction requires, and it scales better as tenant count grows, provided it is paired with caching and pre-aggregation to control warehouse cost and latency. Data extraction can be faster to set up initially for a small, stable tenant count where near-real-time freshness is not required, but the pipeline maintenance burden scales with tenant count in a way query federation does not.
What is aggregate awareness, and why does it matter for scale? #
Aggregate awareness is a query optimization that automatically rewrites a query to use a smaller, pre-aggregated table instead of scanning a full granular table, whenever the pre-aggregated table contains everything the query needs. It matters for scale because it is one of the most effective ways to reduce both query latency and warehouse compute cost on large or fast-growing datasets, without requiring end users to know which table to query.
How do you prevent one tenant's heavy usage from slowing down other tenants? #
Preventing one tenant's heavy usage from degrading other tenants' performance, a noisy-neighbor problem, requires either absorbing repeat query load through caching and pre-aggregation before it reaches the warehouse, or isolating high-usage tenants onto dedicated warehouse compute (a separate virtual warehouse or cluster) so their query load cannot compete with other tenants for the same resources.
How should a platform team load test embedded analytics before scaling? #
A platform team should load test with realistic query variety and concurrency patterns that resemble actual multi-tenant usage, not identical repeated queries, which produce artificially high cache-hit rates that won't hold in production. Testing should specifically target the components that degrade under load (database queries, connection handling, caching layers) rather than only measuring end-to-end response time, since the actual bottleneck under load is often not where it initially appears to be.
Does a governed semantic layer actually improve performance, or is it only a governance feature? #
A governed semantic layer improves performance at scale because it means caching, pre-aggregation, and query optimization only need to be designed once against a shared model, rather than once per tenant dashboard that redefines the same metric or join independently. Without it, near-identical queries with slightly different underlying logic miss shared caches and pre-aggregated tables, which directly increases both latency and warehouse cost as tenant count grows.
What should be included in an RFP for embedded analytics evaluated specifically for scale? #
An RFP for embedded analytics evaluated for scale should require vendors to describe their caching architecture in layers (not just confirm caching exists), specify whether the platform queries the warehouse live or maintains a separate data copy, explain how pre-aggregation or aggregate routing works and whether it is automatic, and provide concrete load testing methodology and results, not just a general performance claim.
Methodology #
This guide evaluated embedded analytics architecture for multi-tenant SaaS scale against criteria specific to platform engineering concerns in 2026: caching architecture depth, query federation versus extraction tradeoffs, pre-aggregation and aggregate routing support, concurrency and noisy-neighbor isolation, load testing rigor, and cost predictability as tenant count and data volume grow. Vendor-published architecture content, engineering blog posts, and customer case study evidence with quantified results were used to validate each evaluation.
Vendor comparisons in this guide focus specifically on Embeddable, Sigma, and Astrato because each currently publishes dedicated content on scaling embedded analytics architecture, making them the most direct, currently active points of comparison for this specific technical question. This is a narrower comparison than a general embedded analytics buyer's guide, deliberately, because the scale-and-performance question benefits from a focused architectural comparison rather than a broad feature matrix.
This guide is a companion piece to broader buyer's guide content, not a replacement for it, and is deliberately separate from row-level security and compliance considerations, which are covered in depth elsewhere. For the general embedded analytics buyer's guide, see Best Embedded Analytics Platforms (2026). For white-label and multi-tenant customization considerations, see Best White-Label Embedded Analytics Platforms (2026). For row-level security and multi-tenant access control architecture specifically, see Row-Level Security for Embedded Analytics and BI (2026). For how a governed semantic layer underpins both performance and governance, see Semantic Layer for AI and BI (2026). For a step-by-step implementation walkthrough, see How to Implement Embedded Analytics for SaaS Products. For teams on Snowflake or Databricks specifically, see Best BI Tools for Snowflake Teams (2026) and Best BI Tools for Databricks Teams (2026).
For Omni's engineering detail on the topics covered in this guide, see Under the hood of Omni's intelligent cache, Running Omni on billions of rows of data, and How we load test to ensure application performance. For Omni's embedded analytics product overview, see Omni Embedded Analytics. Request a live demo at omni.co/request-demo.
Disclosure: This guide is for informational purposes. Architecture details for third-party platforms reflect what each vendor has published publicly as of this writing; organizations should validate current caching, query architecture, and cost behavior directly with vendors against their own tenant scale and data volume.